

Bitcoin has continued to push higher after a weekend dip. As of this article’s writing, the leading cryptocurrency trades for $9,450, a few basis points below the local high of $9,480.
The cryptocurrency is still waiting to surmount the crucial $9,500 level. Yet, analysts say that there’s a rapidly forming Bitcoin bull case.
Related Reading: Economist Steve Hanke: Bitcoin Is Not a Currency, It’s a “Speculative Asset”
Bitcoin’s Technical Outlook Is Starting to Favor Bulls
Until it breaks above $10,500 or below $8,500, Bitcoin is stuck in a macro consolidation. Analysts say, however, that the chance that the cryptocurrency breaks the ongoing range to the upside is strengthening.
One trader shared the chart below, outlining four key technical reasons why Bitcoin could move towards $10,500, then $11,500.
- Bitcoin held the $8,900 resistance, a daily demand zone that has acted as support for the past month.
- BTC is pushing through a diagonal resistance that formed when it hit $10,500 at the start of June.
- Bitcoin is moving above Q2’s volume-weighted average price.
- The one-day relative strength index (RSI) has crossed the midpoint of 50. This is important as the RSI midpoint has acted as an inflection point for Bitcoin’s trends over the past two years.
- The cryptocurrency remains above the 200-day exponential moving average.
BTC analysis by trader 'CJ" (@irnCrypt on Twitter). Chart from TradingView.com
Considering the technical factors, the trader postulated that Bitcoin could test $10,500, then $11,500 in the weeks ahead.
The trader did note, however, that there are some technical occurrences that could force him to change his bias. These include Bitcoin failing to break above $10,500 yet again, the RSI falling under 50, and a price drop on an influx of volume.
Not the Only Positive Analyst
The trader who shared the chart above is notably not the only analyst who is starting to lean bullish on cryptocurrencies.
As reported by NewsBTC, an analyst observed that Bitcoin has formed a “hidden bullish divergence” with its three-day RSI. The divergence suggests that the cryptocurrency will surge to $10,500 and will only be invalidated if BTC falls under $8,800, he remarked.
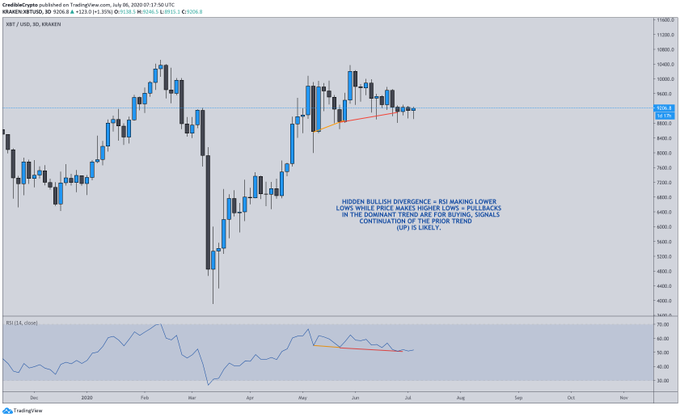
Bitcoin relative strength index analysis by trader Credible Crypto (@CredibleCrypto on Twitter). Chart from Tradingview.com
BTC is also being boosted by altcoins.
While Bitcoin is up a modest 5-6% in the past three days, multiple altcoins have gone parabolic. Cardano, VeChain, and Dogecoin are among the few dozen cryptocurrencies that have gained over 30-40% in the past three days alone.
These cryptocurrencies have done so well that Bloomberg, Dave Portnoy, and other prominent names in the investing space are talking about digital assets again.
Considering the reach of these individuals and firms, this spotlight could trigger an influx of buying interest in Bitcoin.
Featured Image from Shutterstock
Price tags: xbtusd, btcusd, btcusdt
Charts from TradingView.com
These Four Technical Signs Show Bitcoin Is Preparing to Test $10,500


