

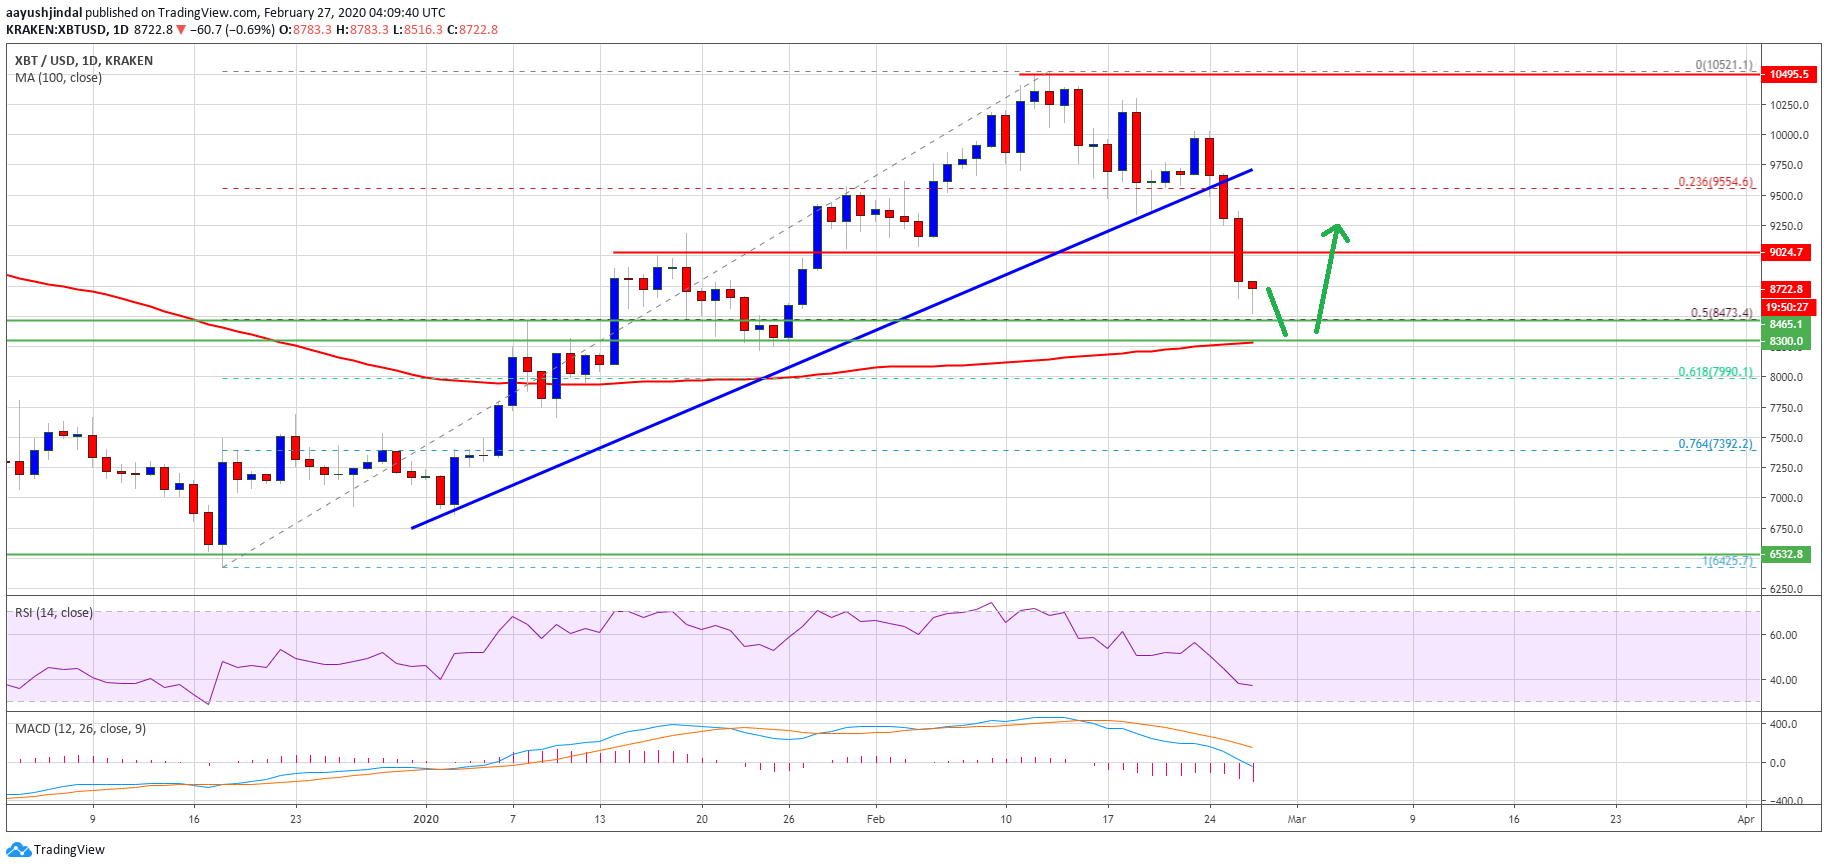
Bitcoin started a major downside correction from the $10,521 yearly high against the US Dollar. BTC price declined below $9,000, but it is still in a larger uptrend above $8,000.
- Bitcoin started a major correction from well above the $10,000 level against the US Dollar.
- The price is down more than 15% from the high and it recently traded below $9,000.
- There was a break below a key bullish trend line with support at $9,580 on the daily chart of the BTC/USD pair (data feed from Kraken).
- The pair is likely to find a strong buying interest near the $8,470 and $8,300 levels.
Bitcoin Price Could Bounce Back Sharply
In the past two days, bitcoin saw an increase in selling pressure below the $10,000 pivot level. As a result, BTC price broke a few key supports near the $9,800 and $9,600 levels to enter a short term bearish zone.
There was a close below the $9,800 level and the 100-day simple moving average. Moreover, there was a break below the 23.6% Fib retracement level of the major upward move from the $6,425 low to $10,521 high.
During the decline, there was a break below a key bullish trend line with support at $9,580 on the daily chart of the BTC/USD pair. Bitcoin even declined below the $9,000 support level.
It is now approaching the $8,475 support area (the previous breakout zone). It coincides with the 50% Fib retracement level of the major upward move from the $6,425 low to $10,521 high.
The next immediate support is near the $8,300 level and the 100-day simple moving average. Therefore, bitcoin is likely to find a strong buying interest near the $8,475 and $8,300 support levels, and it could bounce back sharply.
On the upside, an initial resistance is near the $9,000 level. A successful close above the $9,000 and $9,020 levels is likely to set the pace for a fresh increase in the coming days.
Why $8,000 Is Significant?
Clearly, there are many key supports for bitcoin near $8,300 and the 100-day SMA, below which there is a risk of a drop towards the $8,000 support area.
The 61.8% Fib retracement level of the same wave is also near $8,000. For that reason, the $8,000 support holds the key. If the bulls fail to defend $8,000, there are chances of a strong decline towards the $7,000 and $6,800 levels.
Technical indicators:
Daily MACD – The MACD is slowly gaining momentum in the bearish zone.
Daily RSI (Relative Strength Index) – The RSI for BTC/USD is now well below the 50 level.
Major Support Levels – $8,475 followed by $8,300.
Major Resistance Levels – $9,000, $9,500 and $10,000.


