
Solana (SOL) jumped past a critical resistance level that had limited its recovery attempts during the November 2021-March 2022 price correction multiple times, thus raising hopes of more upside in April.
Solana flips key resistance to support
To recap, SOL’s price underwent extreme pullbacks upon testing its multi-month downward sloping trendline in recent history.
For instance, the SOL/USD pair dropped by 60% two months after retracing from the said resistance level in December 2021. Similarly, it had fallen by over 40% in a similar retracement move led by a selloff near the trendline in November 2021.
But Solana flipped the resistance trendline as support (S/R flip) after breaking above it on March 30, accompanied by a rise in trading volume that showed traders’ conviction in the breakout move. In doing so, SOL’s price rallied by 25% to reach $135, bringing the psychological resistance level of $150 within reach.
Why is SOL (technically) bullish?
From a technical perspective, SOL’s breakout move above its falling trendline resistance coincided with a bullish crossover between its two key moving averages: the 20-day exponential moving average (20-day EMA; the green wave) and the 50-day EMA (the red wave).
Dubbed the golden cross, the technical indicator occurs when an asset’s short-term moving average jumps above its long-term moving average. Traditional analysts consider this crossover as a buying signal.
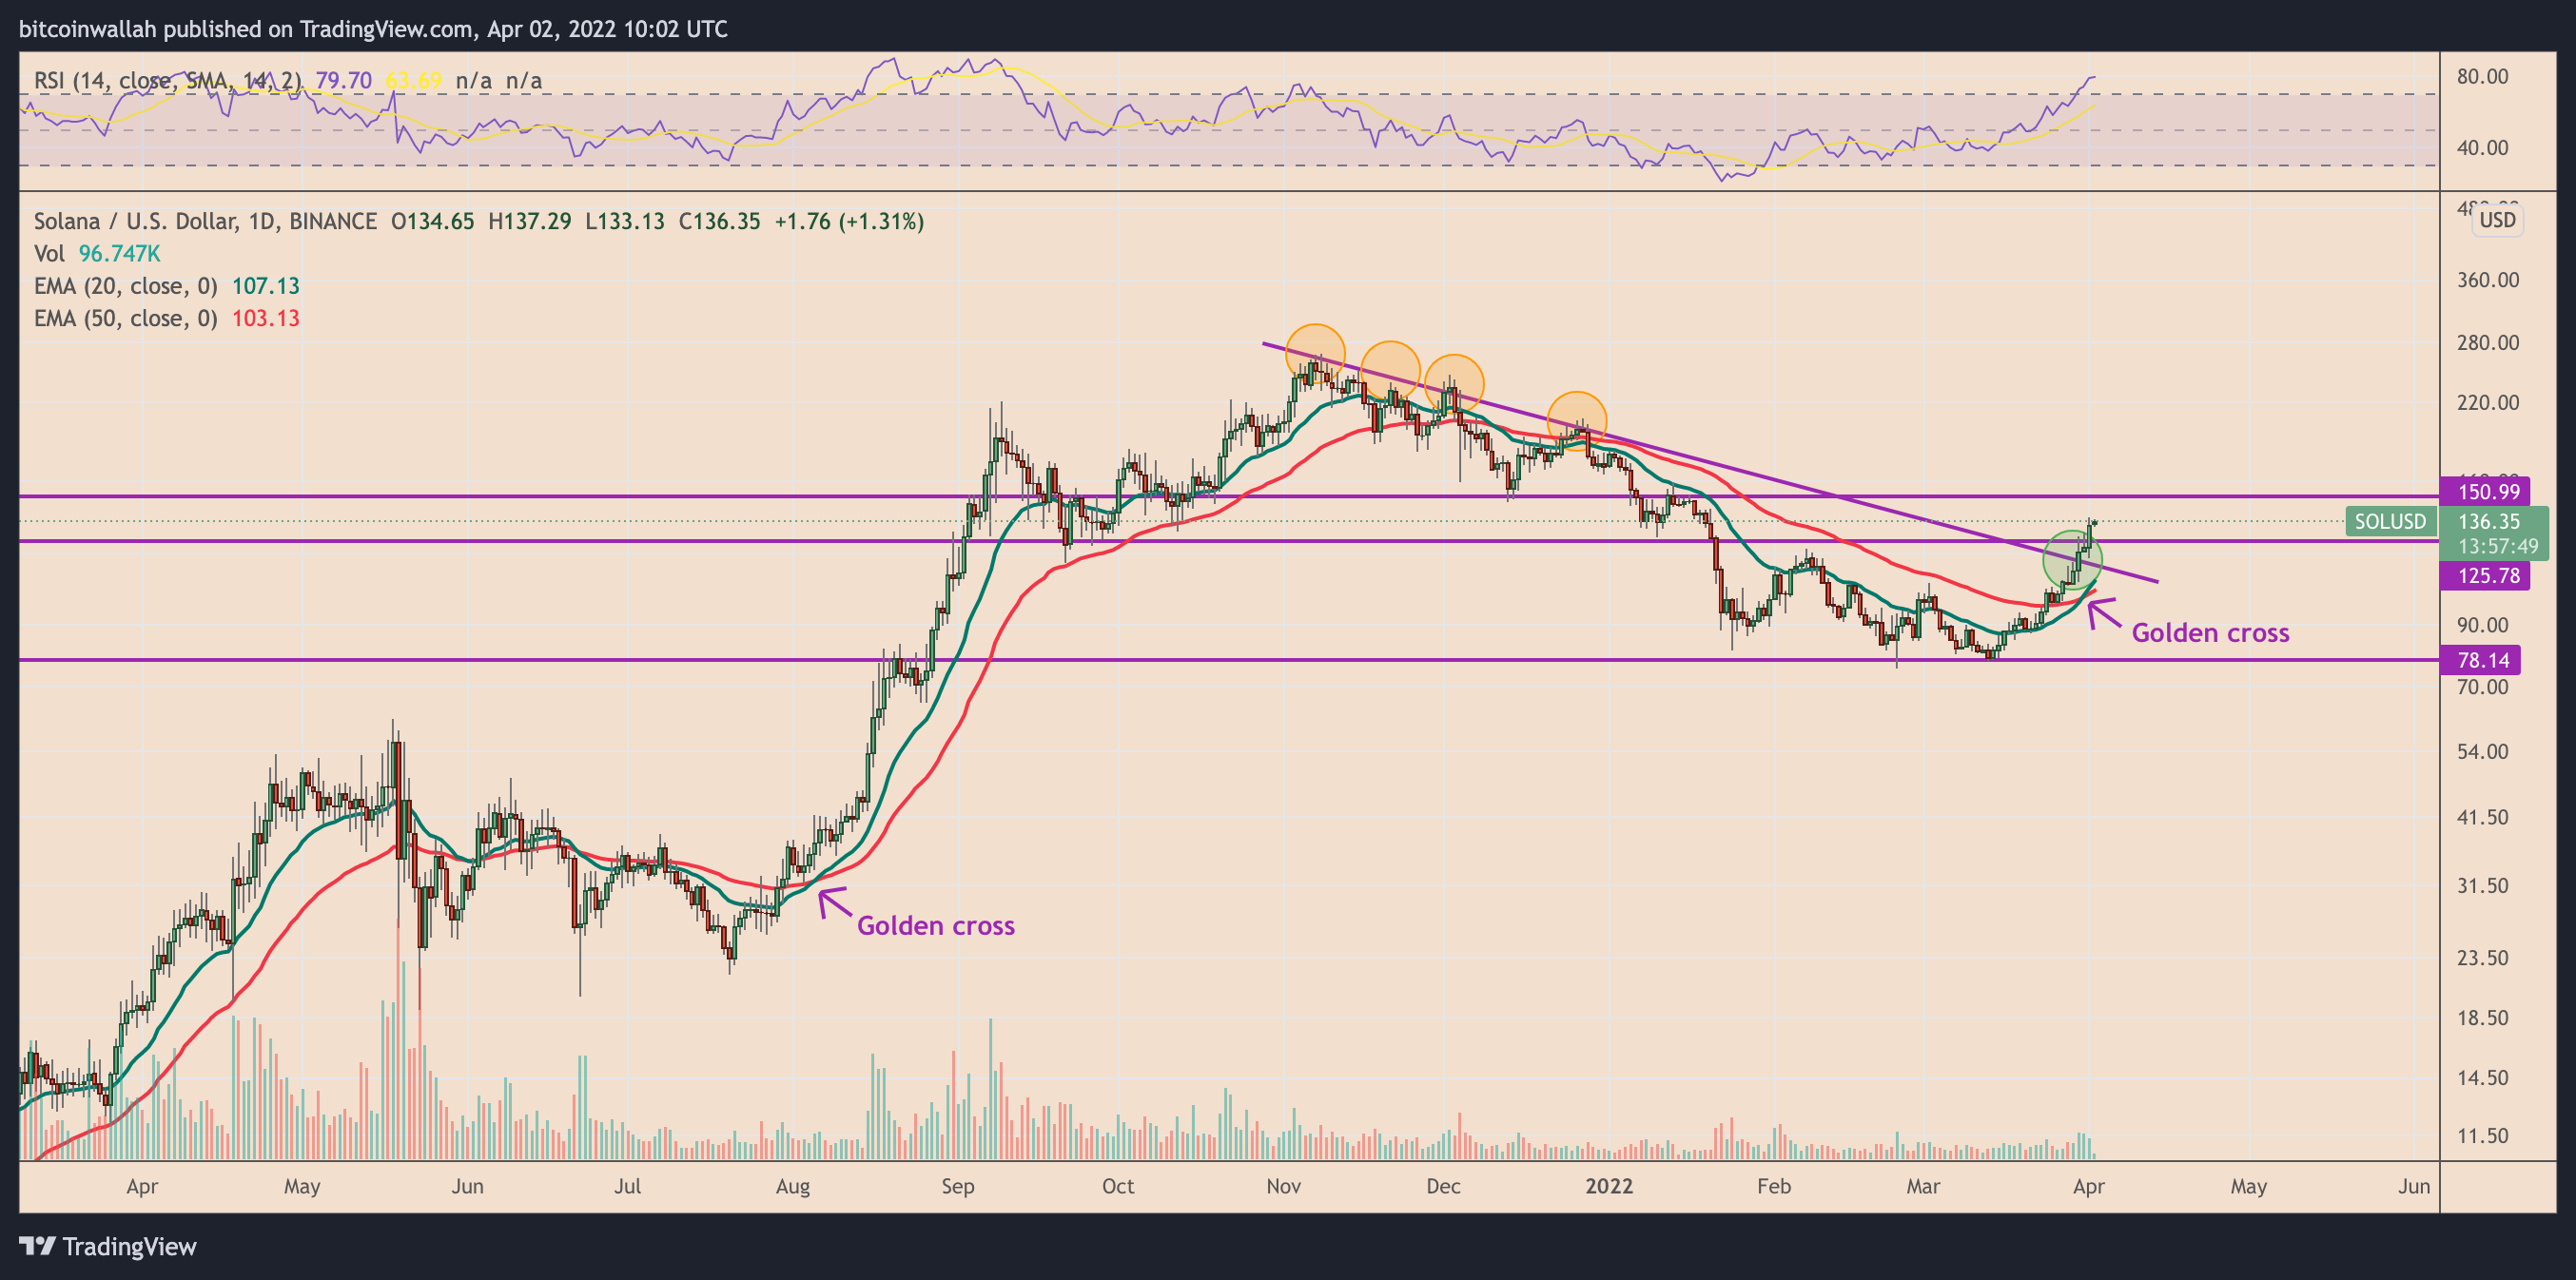
For instance, the 20-50 EMA crossover in August 2020 may have assisted in pushing SOL’s price upward by more than 650% to over $267, in addition to other fundamental and technical catalysts. As such, the golden cross boosts SOL’s likelihood of continuing its rally, as well as its breakout above the falling trendline resistance.
RSI divergence
The upside prospects increase further if a technical fractal highlighted by Delphi Digital is to be believed.
The crypto research firm highlighted a correlation between SOL’s price and the combination of its two technical indicators: the S/R flip and relative strength index (RSI) divergence.
Notably, the first time Solana’s RSI jumped above 70, an “overbought” area, after a strong price uptrend — that had it also break above the descending trendline support of that period — SOL tended to continue rallying despite its RSI consolidating lower or sideways.
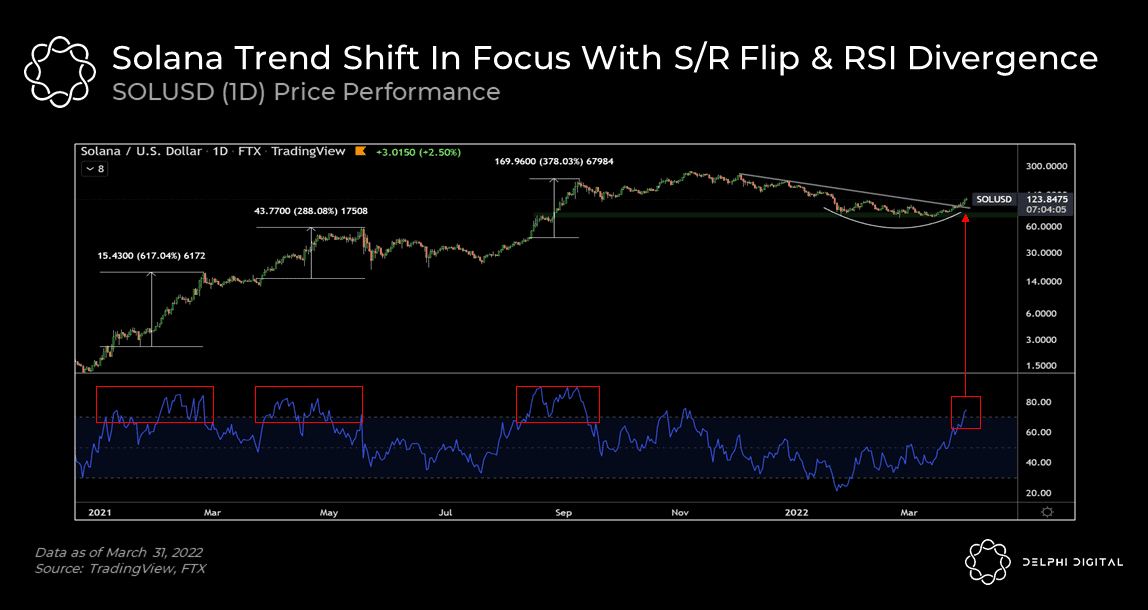
For instance, SOL rallied 378% after the first time its RSI broke above 70 in August 2021. Similarly, the period of an overbought RSI during May-June 2021 also coincided with Solana’s 268% upside move. The fractals appeared similar to how SOL has been performing lately, suggested Delphi Digital.
Related: Opera integrates Bitcoin, Solana, Polygon and five other blockchains
Therefore, SOL/USD could continues its uptrend when using Fibonacci retracement levels, drawn between $261-swing high to $77.50-swing low, suggesting $147-$150 as the interim upside target.
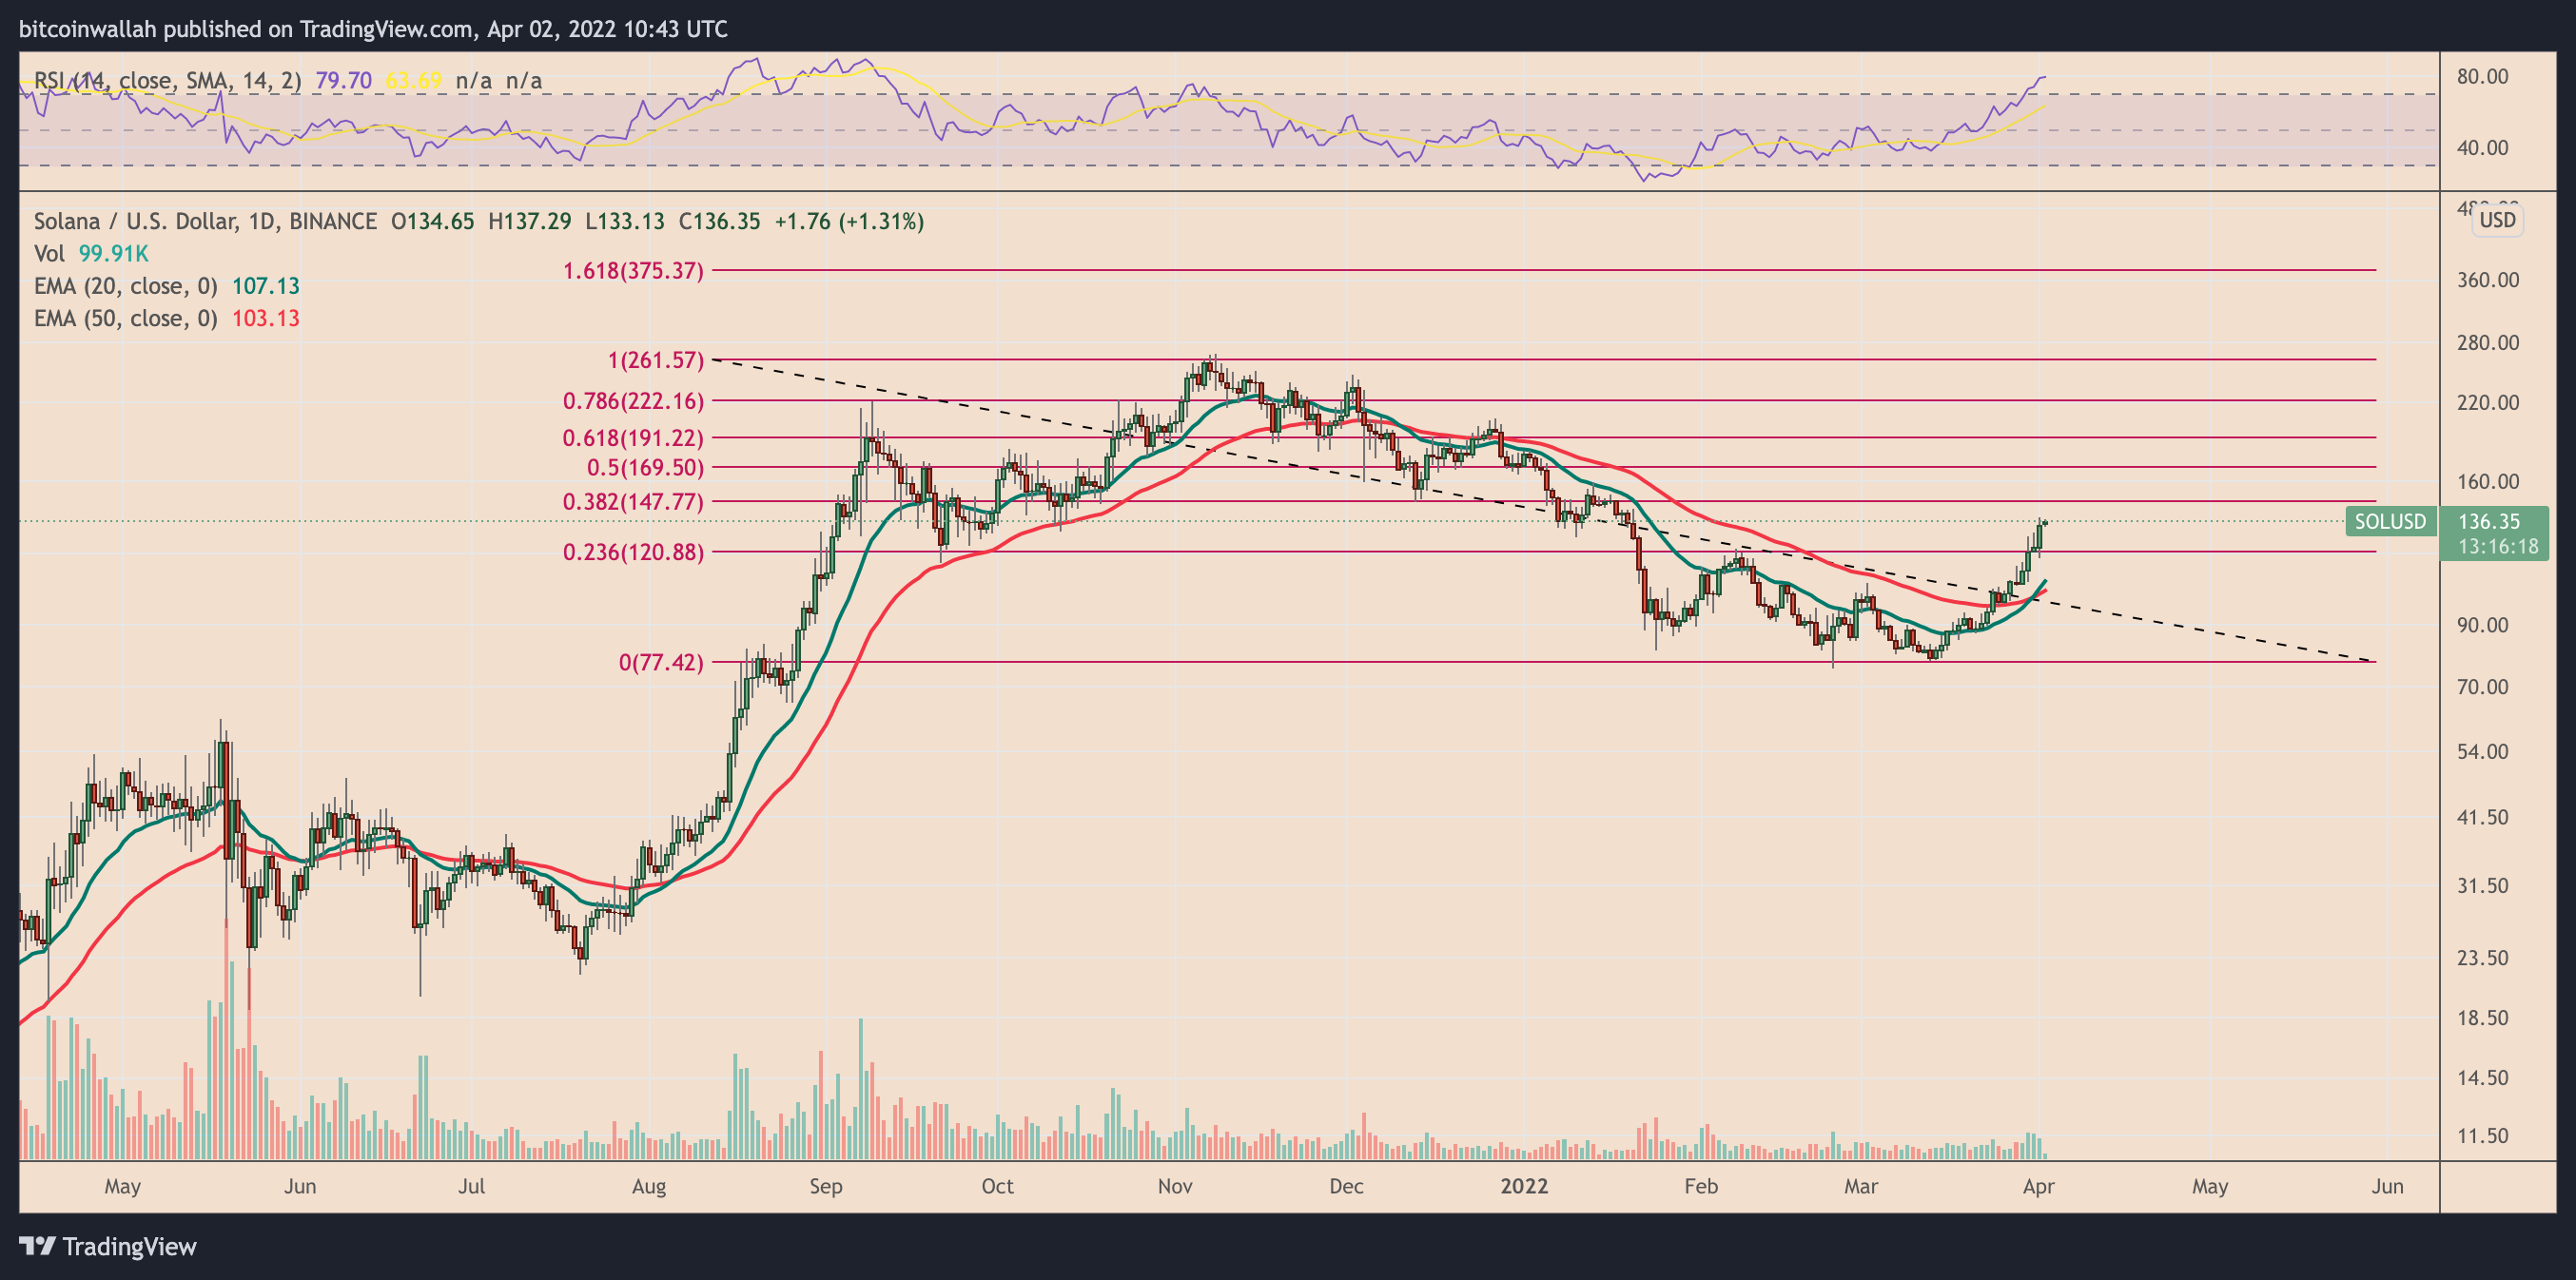
Conversely, a pullback upon or ahead of testing the $147-$150 price range can result in SOL retesting the $120 as its interim support, with a possible slide toward the 20- and 50-day EMAs.
The views and opinions expressed here are solely those of the author and do not necessarily reflect the views of Cryptox.com. Every investment and trading move involves risk, you should conduct your own research when making a decision.


