

Ripple is currently consolidating above the $0.2100 support against the US Dollar. XRP price is showing bearish signs, but it could start a fresh increase as long as it is above the 100 SMA (H4).
- Ripple price is currently struggling to stay above the $0.2100 support against the US dollar.
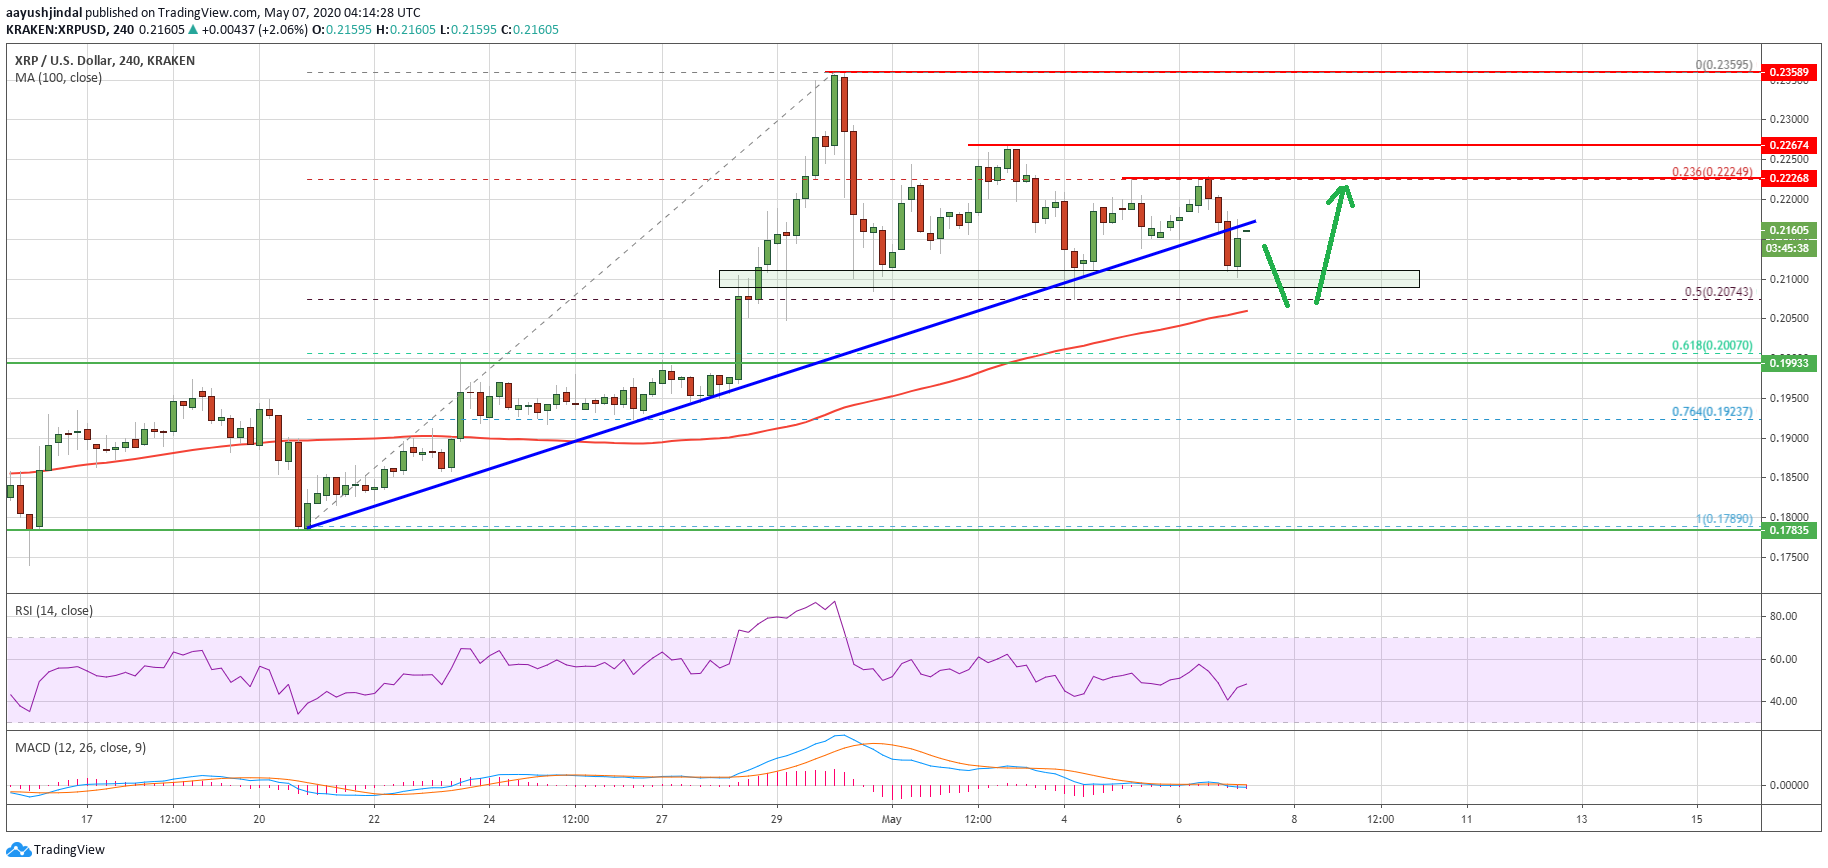
- The price is facing a couple of important hurdles near the $0.2220 and $0.2265 levels.
- There was a break below a key bullish trend line with support near $0.2160 on the 4-hours chart of the XRP/USD pair (data source from Kraken).
- The pair must stay above $0.2050 and the 100 SMA (H4) to start a fresh increase.
Ripple Price Trading Near Crucial Juncture
This past month, ripple surged above the $0.2000 and $0.2100 resistance levels to move into a positive zone. XRP price traded as high as $0.2359, settled well above the 100 simple moving average (4-hours), and recently started a downside correction.
There was a break below the $0.2200 support zone. The price declined below the 23.6% Fib retracement level of the upward move from the $0.1789 low to $0.2359 high.
However, the $0.2100 region is acting as a strong support. The 50% Fib retracement level of the upward move from the $0.1789 low to $0.2359 high is also acting as a support.
In the past few days, ripple traded in a broad range above $0.2100, but it struggled to clear the $0.2250 resistance zone. There was a downside reaction and a break below a key bullish trend line with support near $0.2160 on the 4-hours chart of the XRP/USD pair.
The pair is still trading above the $0.2100 support area, but it is now struggling to recover above the broken trend line and $0.2180. To move into a positive zone, the price must surpass the $0.2200 and $0.2250 resistance levels.
The next major resistance is near the $0.2265, above which the bulls are likely to aim a larger upward move towards the $0.2350 and $0.2420 levels.
Reversal Chances?
On the downside, there is a key support forming near $0.2100. The most important uptrend support is near the $0.2050 level and the 100 simple moving average (4-hours).
If the price fails to stay above the 100 SMA (H4) and declines below $0.2000, there are chances of a bearish reversal towards the $0.1800 level.
Technical Indicators
4-Hours MACD – The MACD for XRP/USD is slowly gaining momentum in the bearish zone.
4-Hours RSI (Relative Strength Index) – The RSI for XRP/USD is currently below the 50 level, with bearish signs.
Major Support Levels – $0.2100, $0.2070 and $0.2050.
Major Resistance Levels – $0.2200, $0.2250 and $0.2350.
Take advantage of the trading opportunities with Plus500
Risk disclaimer: 76.4% of retail CFD accounts lose money.


