

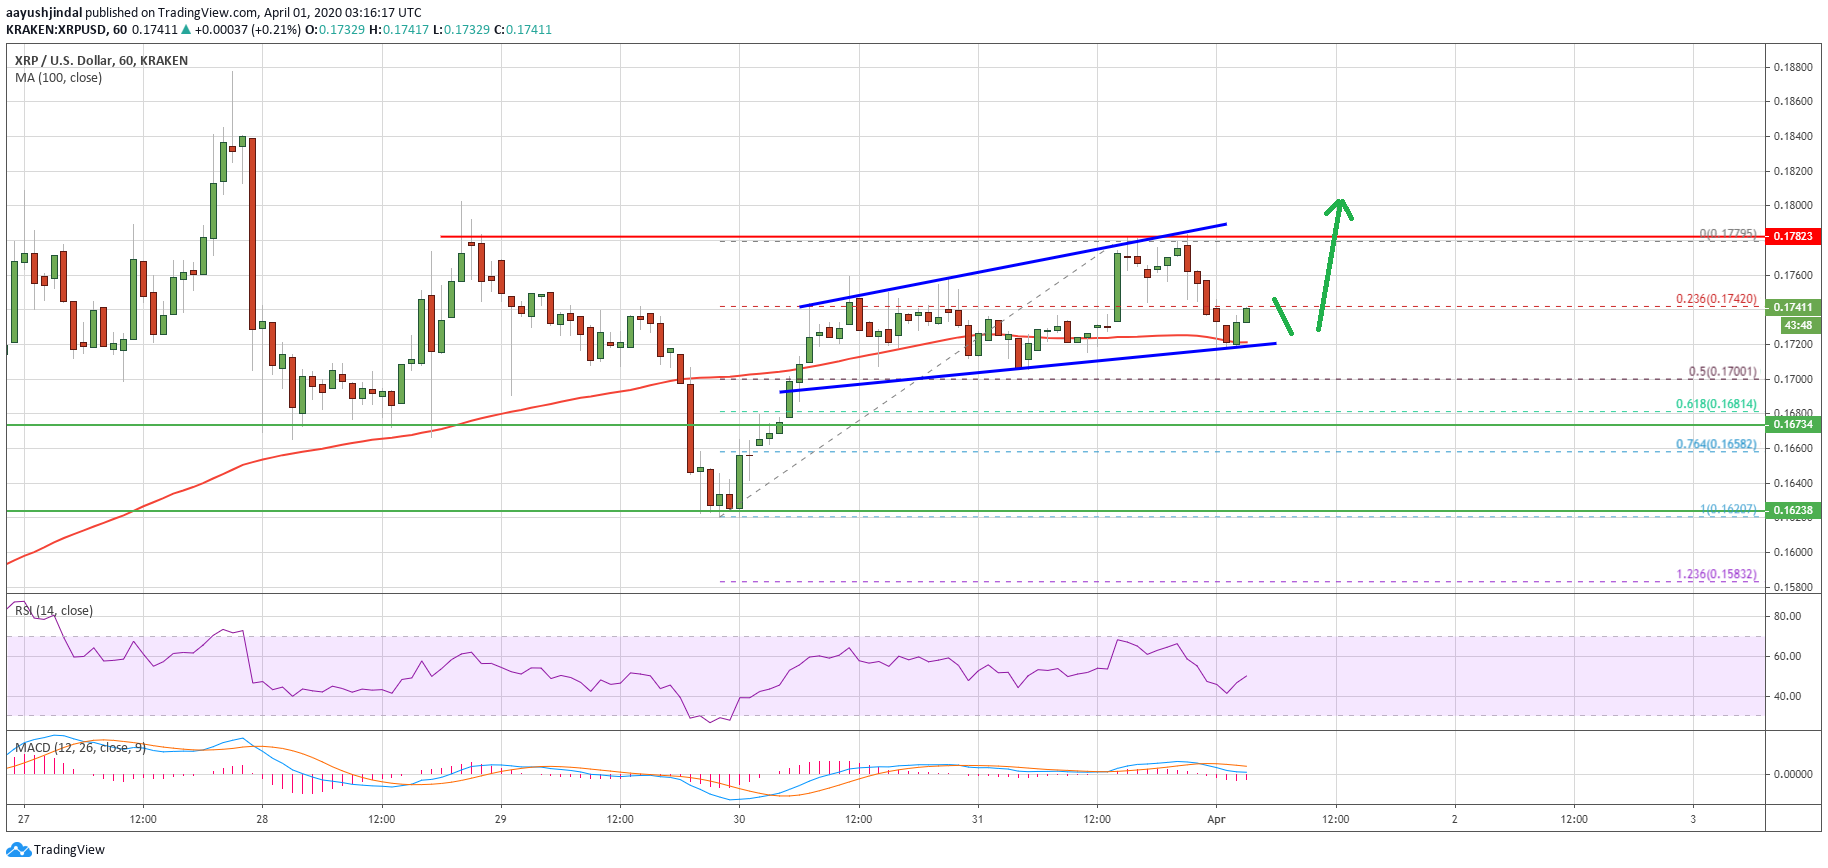
Ripple is still struggling to surpass the $0.1780 resistance area against the US Dollar. XRP price is currently holding the 100 hourly SMA and it could rise again.
- Ripple price is still facing a strong hurdle near $0.1750 and $0.1780 against the US dollar.
- There key supports forming near the $0.1720 and the 100 hourly SMA.
- There is an expanding triangle forming with resistance near $0.1780 on the hourly chart of the XRP/USD pair (data source from Kraken).
- The pair is likely to rally above $0.1780 in the short term as long as it is above $0.1700.
Ripple Price Testing Key Support
Yesterday, there was a steady rise in ripple above the $0.1700 resistance area. XRP price traded above the $0.1720 resistance area and the 100 hourly simple moving average.
However, the price struggled to gain momentum above the $0.1750 and $0.1780 resistance levels. The bulls failed once again near $0.1780 and a high was formed near $0.1779.
Ripple is currently correcting lower and trading below the $0.1750 level. There was a break below the 23.6% Fib retracement level of the upward move from the $0.1620 low to $0.1779 high.
On the downside, the $0.1720 pivot area and the 100 hourly simple moving average are currently acting as supports. There is also an expanding triangle forming with resistance near $0.1780 on the hourly chart of the XRP/USD pair.
If the pair fails to stay above the triangle support and the 100 hourly SMA, it could correct further towards the main $0.1700 support area. The 50% Fib retracement level of the upward move from the $0.1620 low to $0.1779 high is also near the $0.1700 level.
Any further losses may perhaps start a substantial decline and the price is likely to decline towards the $0.1620 support area.
Bullish Break?
If ripple remains well bid above the 100 hourly SMA, it could rise steadily. On the upside, the main resistance is near the $0.1780 area.
A clear break and close above the $0.1780 resistance is likely to set the pace for a sharp rally. In the mentioned bullish case, the bulls are likely to aim a test of the $0.1880 and $0.1920 resistance levels in the near term.
Technical Indicators
Hourly MACD – The MACD for XRP/USD is slowly losing momentum in the bearish zone.
Hourly RSI (Relative Strength Index) – The RSI for XRP/USD is rising towards the 50 level.
Major Support Levels – $0.1720, $0.1700 and $0.1620.
Major Resistance Levels – $0.1750, $0.1780 and $0.1880.
Take advantage of the trading opportunities with Plus500
Risk disclaimer: 76.4% of retail CFD accounts lose money.


