

- Ripple price is under pressure and struggling to surpass the $0.2660 resistance against the US dollar.
- The price is currently declining and it is likely to break the $0.2580 support area.
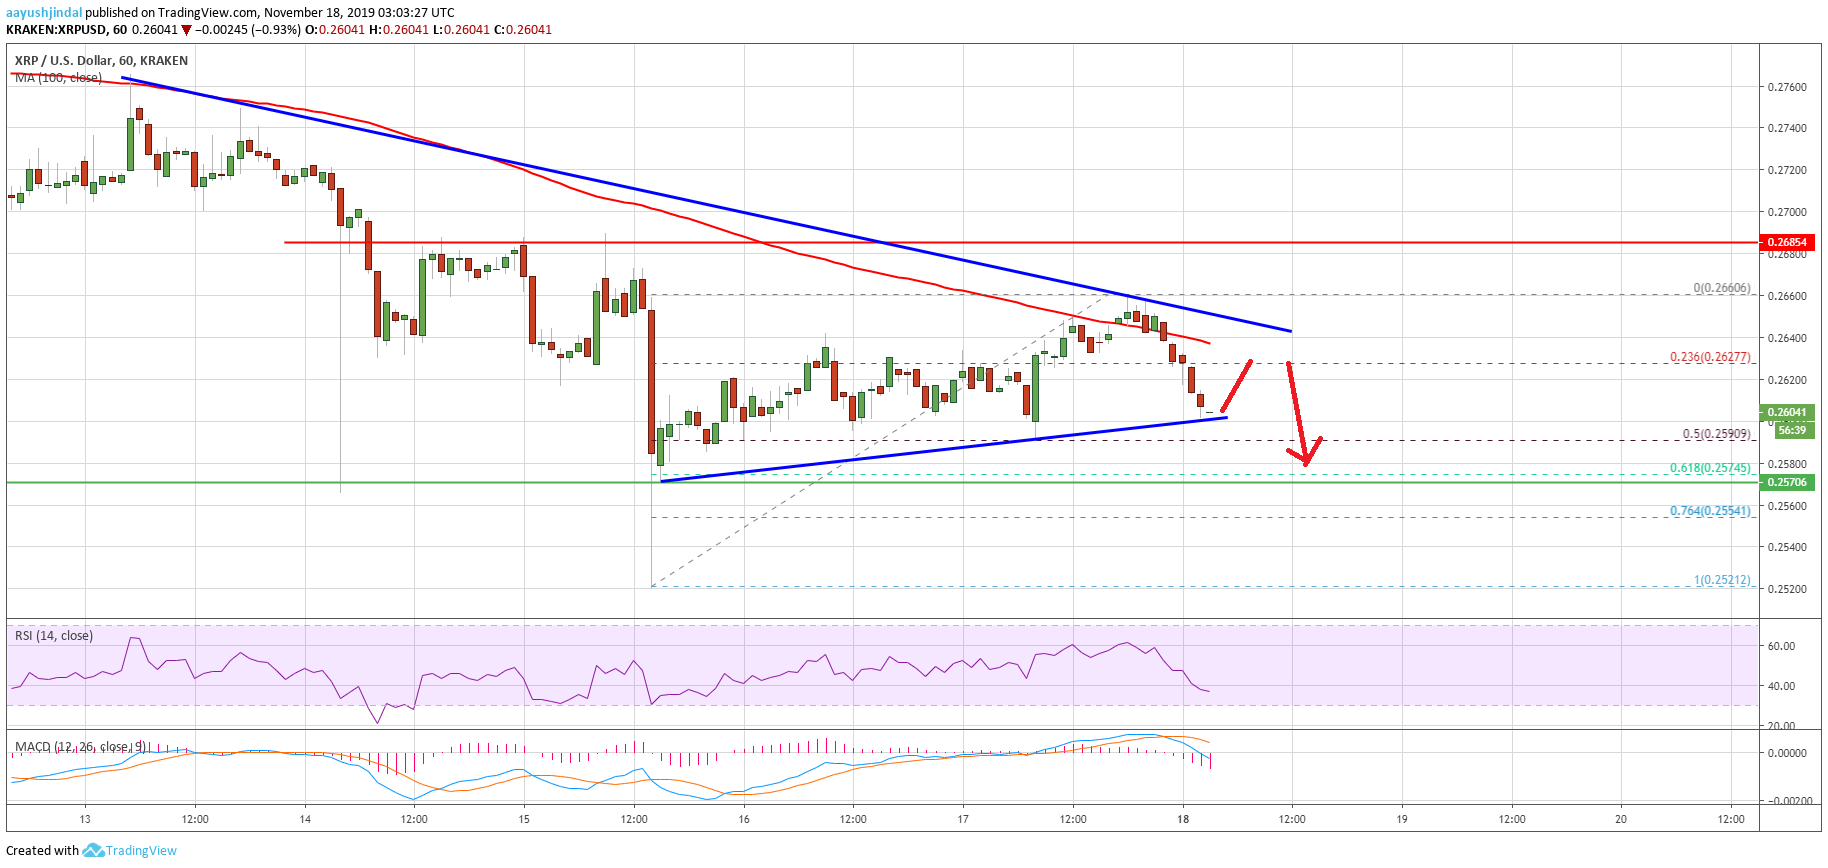
- There is a major bearish trend line forming with resistance near $0.2645 on the hourly chart of the XRP/USD pair (data source from Kraken).
- Conversely, Ethereum is still holding the main $180 and $178 support levels.
Ripple price is facing an increase in selling below $0.2650 against the US Dollar, similar to bitcoin. XRP price could continue to move down below $0.2600 and $0.2580.
Ripple Price Analysis
After a sharp decline below the $0.2600 support, ripple recovered from the $0.2521 low against the US Dollar. XRP/USD corrected above the $0.2600 and $0.2620 resistance levels.
However, the price faced a strong resistance near the $0.2660 level and the 100 hourly simple moving average. There was no close above the 100 hourly SMA, resulting in a fresh bearish reaction.
The price broke the $0.2620 support level. Moreover, ripple decline below the 23.6% Fib retracement level of the upward move from the $0.2521 low to $0.2660 high. It has opened the doors for more losses below the $0.2600 support.
An immediate support is near the $0.2580 level and a connecting bullish trend line on the hourly chart of the XRP/USD pair. If there is a downside break below the trend line support, the price is likely to decline further below the $0.2570 support.
The next major support is near the $0.2520 level, below which the price may even break $0.2500. Any further losses might lead ripple towards the $0.2450 support area.
On the upside, there are many hurdles near the $0.2660 level and the 100 hourly SMA. Additionally, there is a major bearish trend line forming with resistance near $0.2645 on the same chart.
Therefore, a clear break above the $0.2660 resistance and the 100 hourly SMA is needed for a decent upward move. The next resistance is near $0.2685, above which the price is likely to climb towards the $0.2750 resistance area in the near term.
Looking at the chart, ripple price is clearly trading in a bearish zone below the $0.2700 and $0.2660 levels. On the downside, the $0.2520 and $0.2500 support levels are very important. Any further declines could its accelerate decline and the price may even struggle to hold $0.2450.
Technical Indicators
Hourly MACD – The MACD for XRP/USD is currently moving heavily in the bearish zone.
Hourly RSI (Relative Strength Index) – The RSI for XRP/USD is now well below the 50 level, but showing a few correction signs.
Major Support Levels – $0.2600, $0.2580 and $0.2520.
Major Resistance Levels – $0.2660, $0.2685 and $0.2720.


