

Ripple seems to be forming a strong support near $0.2295 against the US Dollar. XRP price is showing breakout signs and it could start a significant recovery wave above $0.2450.
- Ripple is up 2% and it cleared a major technical breakout pattern against the US dollar.
- The price seems to be forming a decent support base near the $0.2300 and $0.2295 levels.
- There was a break above a crucial bearish trend line with resistance near $0.2380 on the 4-hours chart of the XRP/USD pair (data source from Kraken).
- The pair likely to climb higher towards the 100 simple moving average (4-hours) if it clears $0.2450.
Ripple Price Forming Support Base
This past week, we saw a sharp decline in bitcoin, Ethereum, and ripple below key supports. XRP price even broke the $0.2550 support level and settled well below the 100 simple moving average (4-hours).
A new monthly low is formed near $0.2297, and the price seems to be forming a decent support base near the $0.2300 and $0.2295 levels. Recently, there was a positive price action and XRP climbed above the $0.2320 pivot level.
There was also a break above a crucial bearish trend line with resistance near $0.2380 on the 4-hours chart of the XRP/USD pair. The pair is now trading near the $0.2450 resistance, which is just below the 23.6% Fib retracement level of the downward move from the $0.3043 high to $0.2297 low.
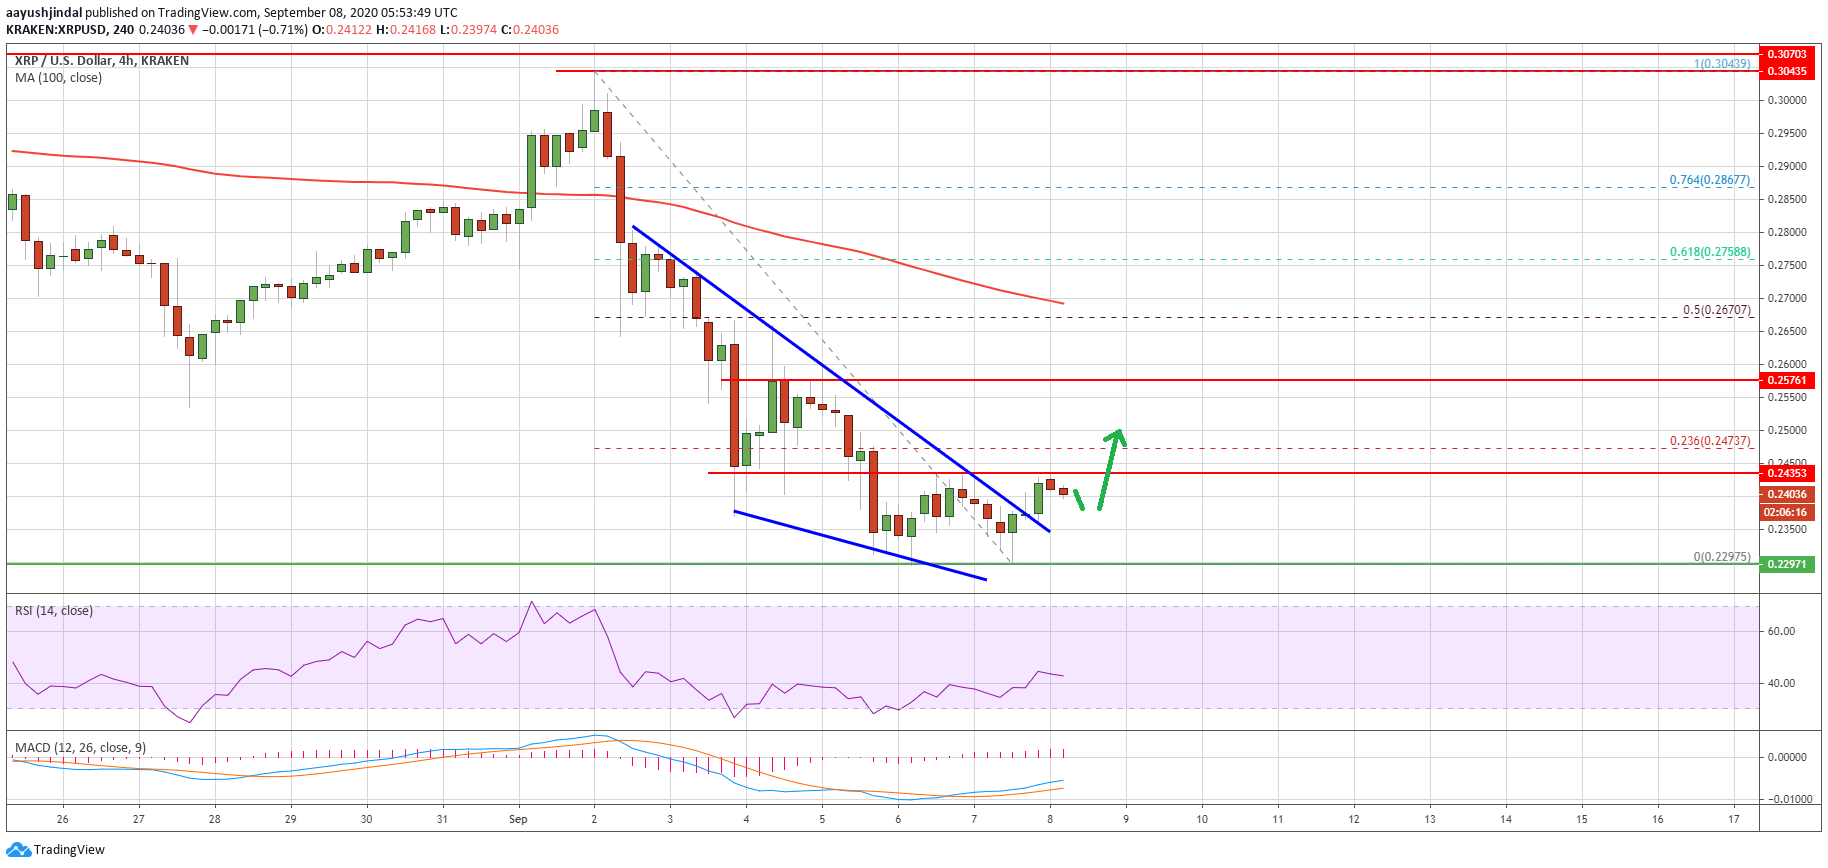
Ripple (XRP) price trades above $0.2400. Source: TradingView.com
If there is a clear break above the $0.2450 resistance, there could be a sharp upward move. The next major resistance is near the $0.2550 and $0.2570 levels
Any further gains could lead the price towards the $0.2670 resistance level. It is close to the 50% Fib retracement level of the downward move from the $0.3043 high to $0.2297 low.
Fake Breakout in XRP?
If ripple fails to clear the $0.2450 and $0.2480 resistance levels, there is a risk of a fresh decline. An initial support is near the broken trend line and $0.2350.
The main support is near the $0.2300 and $0.2305 levels, below which the price could invalidate the recent breakout pattern. In the stated case, the bears are likely to aim a drop towards the $0.2200 support.
Technical Indicators
4-Hours MACD – The MACD for XRP/USD is slowly moving into the bullish zone.
4-Hours RSI (Relative Strength Index) – The RSI for XRP/USD is still below the 50 level.
Major Support Levels – $0.2350, $0.2305 and $0.2300.
Major Resistance Levels – $0.2450, $0.2480 and $0.2580.


