

Ripple retested the key $0.2240 support area against the US Dollar. XRP price could start a strong recovery wave once it clears the $0.2350 and $0.2380 resistance levels.
- Ripple price is showing a few positive signs above the $0.2240 level against the US dollar.
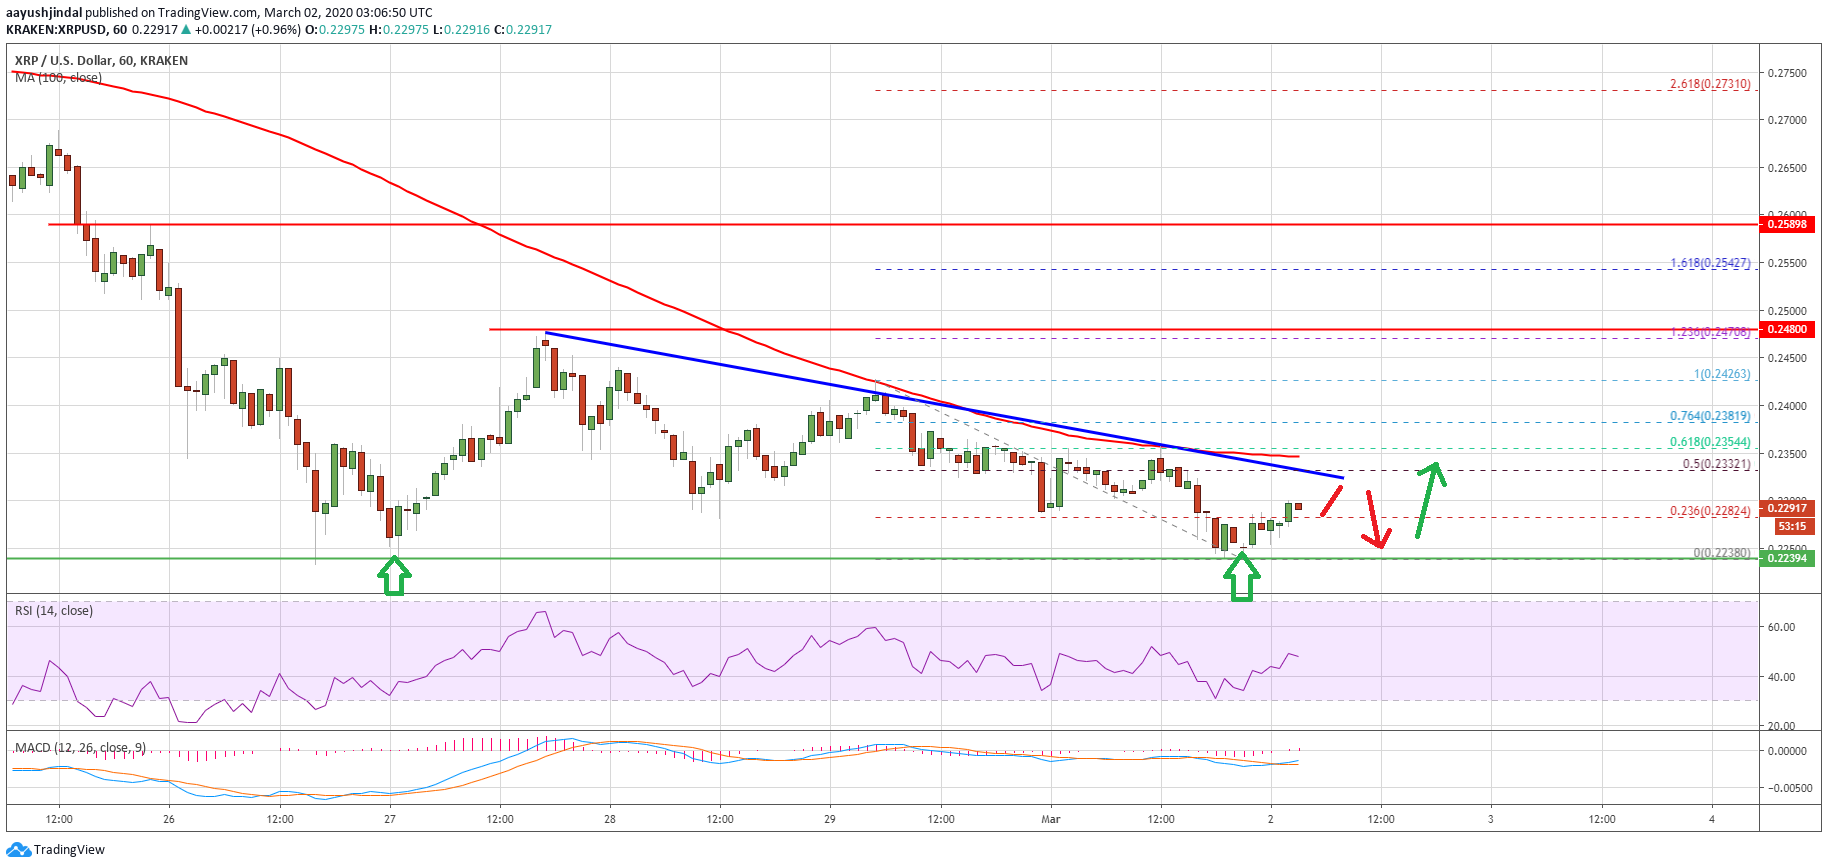
- The price is likely forming a double bottom pattern near the $0.2240 level.
- There is a key bearish trend line forming with resistance near $0.2330 on the hourly chart of the XRP/USD pair (data source from Kraken).
- The price could either start a strong rally towards $0.2500 or decline sharply below $0.2200.
Ripple Price Could Start a Recovery
This past week, we saw a steady decline in ripple below the $0.2500 support area. XRP price even traded below the key $0.2350 support level and the 100 hourly simple moving average.
The bears aimed the $0.2200 support area, but they failed. The price found a strong support near the $0.2230 and $0.2240 levels. The recent low was $0.2238 and the price is currently moving higher.
More importantly, it seems like ripple is forming a double bottom pattern near the $0.2240 level. It is now trading above the 23.6% Fib retracement level of the recent decline from the $0.2426 high to $0.2238 low.
On the upside, an initial resistance is near the $0.2330 zone. There is also a key bearish trend line forming with resistance near $0.2330 on the hourly chart of the XRP/USD pair. A successful break above the trend line resistance, $0.2350, and the 100 hourly simple moving average could initiate a decent recovery wave in the coming sessions.
The next major resistance is near the $0.2380 level, above which the bulls are likely to aim a test of the $0.2500 resistance area. Any further gains could lead the price towards the $0.2650 level.
What If The Bulls Fail?
If ripple fails to climb above the $0.2320 and $0.2350 resistance levels, there are chances of more losses in the near term. The recent double bottom support is near the $0.2235 level, which is likely to act as a breakdown zone.
A successful close below the $0.2235 and $0.2220 support levels may perhaps restart downtrend. The next major support on the downside is near the $0.2200 level, followed by $0.2150.
Technical Indicators
Hourly MACD – The MACD for XRP/USD is slowly moving into the bullish zone.
Hourly RSI (Relative Strength Index) – The RSI for XRP/USD is currently struggling to move above the 50 level.
Major Support Levels – $0.2235, $0.2220 and $0.2200.
Major Resistance Levels – $0.2320, $0.2380 and $0.2500.
 Price Surges to Ten-Week High as Inflation Reduces")
