

Ripple is currently correcting higher from the $0.1810 support against the US Dollar. XRP price is now facing key barriers and it could reverse towards the $0.1650.
- Ripple price is up more than 2% and it is above the $0.1860 level against the US dollar.
- There are still many hurdles near the $0.1900 level and the 100 hourly simple moving average.
- There is a key connecting bearish trend line forming with resistance near $0.1890 on the hourly chart of the XRP/USD pair (data source from Kraken).
- The pair could struggle to gain bullish momentum above the $0.1890 and $0.1900 resistance levels.
Ripple Price Facing Hurdles
Yesterday, we saw more losses in ripple below the $0.1850 level. XRP price traded to a new monthly low at $0.1812 and it is currently correcting higher.
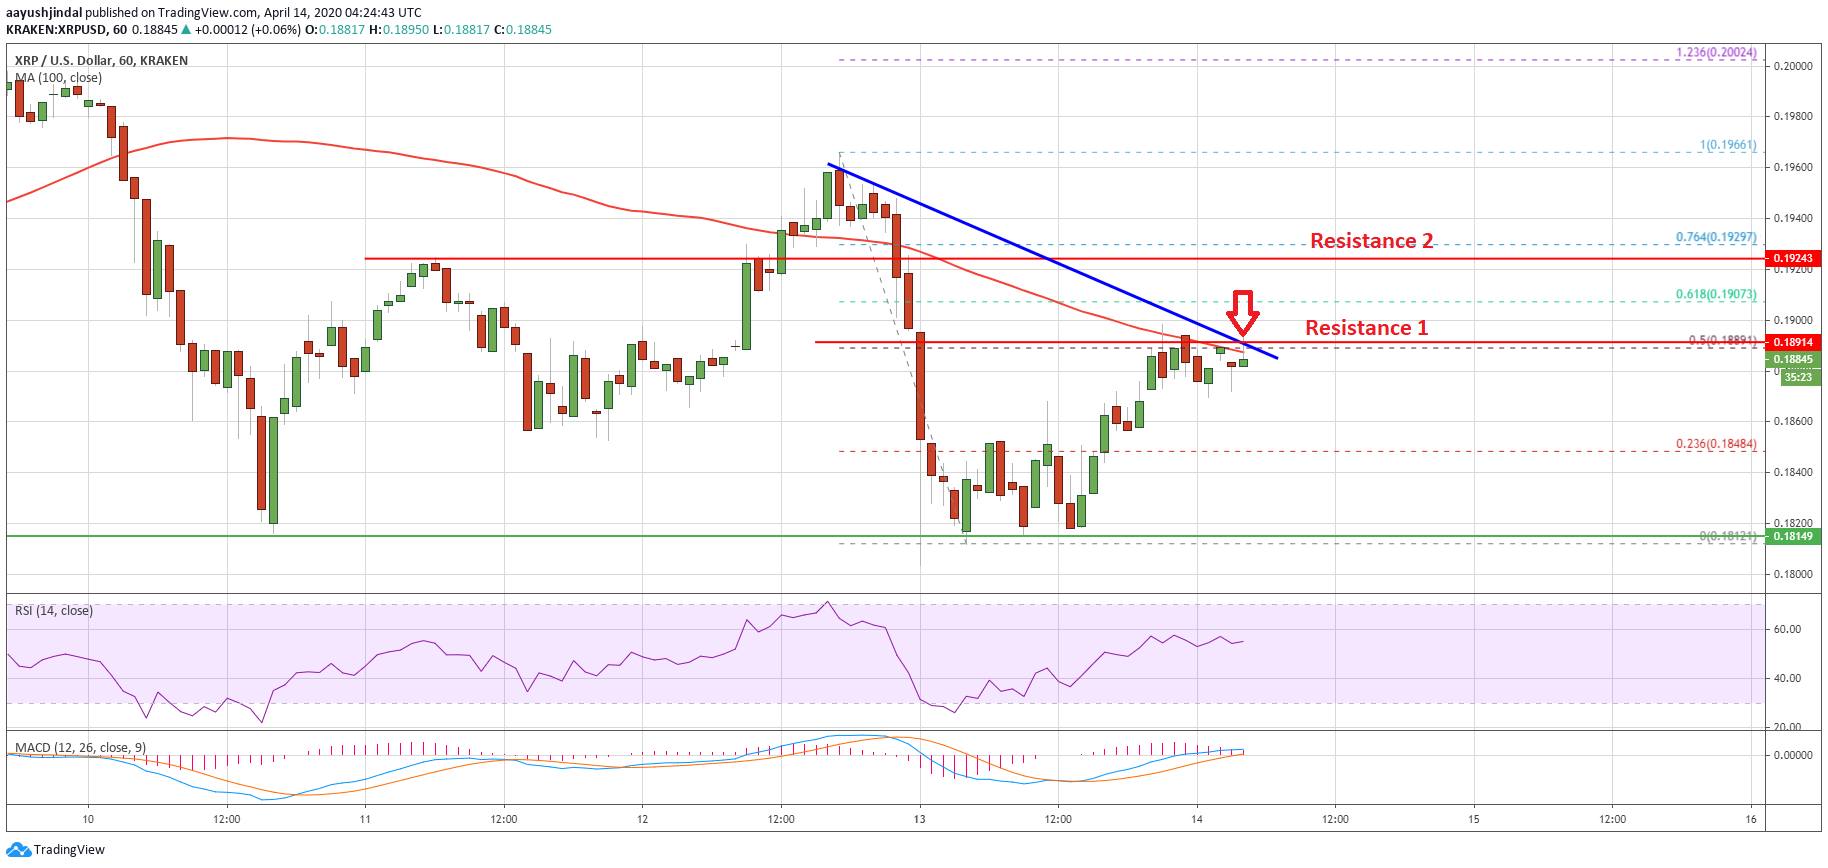
There was a decent support base forming above the $0.1820 and $0.1840 levels. The price is now trading above the $0.1850 level, plus the 23.6% Fib retracement level of the recent drop from the $0.1965 high to $0.1812 low.
However, ripple price is now facing a strong resistance near the $0.1890 level and the 100 hourly simple moving average. The 50% Fib retracement level of the recent drop from the $0.1965 high to $0.1812 low is also acting as a major hurdle for the bulls.
More importantly, there is a key connecting bearish trend line forming with resistance near $0.1890 on the hourly chart of the XRP/USD pair. The pair is likely to struggle near the $0.1890 and $0.1900 levels in the near term.
To move into a positive zone, the bulls need to gain pace above the $0.1920 level. The next key resistance is near the $0.1965 swing high, above which the price is likely to accelerate towards the $0.2000 level.
Reversal?
If ripple fails to continue above the 100 hourly SMA or the $0.1900 resistance, there are chances of a fresh decline in the coming sessions.
An initial support on the downside is near the $0.1850 level. The main support is near the $0.1810 and $0.1800 levels, below which the bears are likely to aim a test of the $0.1650 level in the near term.
Technical Indicators
Hourly MACD – The MACD for XRP/USD is struggling to gain momentum in the bullish zone.
Hourly RSI (Relative Strength Index) – The RSI for XRP/USD is now sliding and it might break the 50 level.
Major Support Levels – $0.1850, $0.1810 and $0.1800.
Major Resistance Levels – $0.1890, $0.1900 and $0.1920.
Take advantage of the trading opportunities with Plus500
Risk disclaimer: 76.4% of retail CFD accounts lose money.


