

Ripple remained strong above $0.1900 and $0.1920 against the US Dollar. However, XRP must surpass the $0.2000 and $0.2050 resistance levels to gain bullish momentum in the near term.
- Ripple is slowly moving higher and it is trading above the $0.1950 level against the US dollar.
- The price is currently facing a couple of key resistances near $0.2000 and $0.2050.
- There was a break above a key bearish trend line with resistance near $0.1975 on the hourly chart of the XRP/USD pair (data source from Kraken).
- The pair could gain bullish momentum if it clears the $0.2000 or $0.2050 resistance levels.
Ripple Price is Facing Hurdles
After testing the $0.1850 support zone, ripple started a decent upward move above $0.1900. XRP price broke the $0.1900 and $0.1920 resistance levels to move into a short term bullish zone.
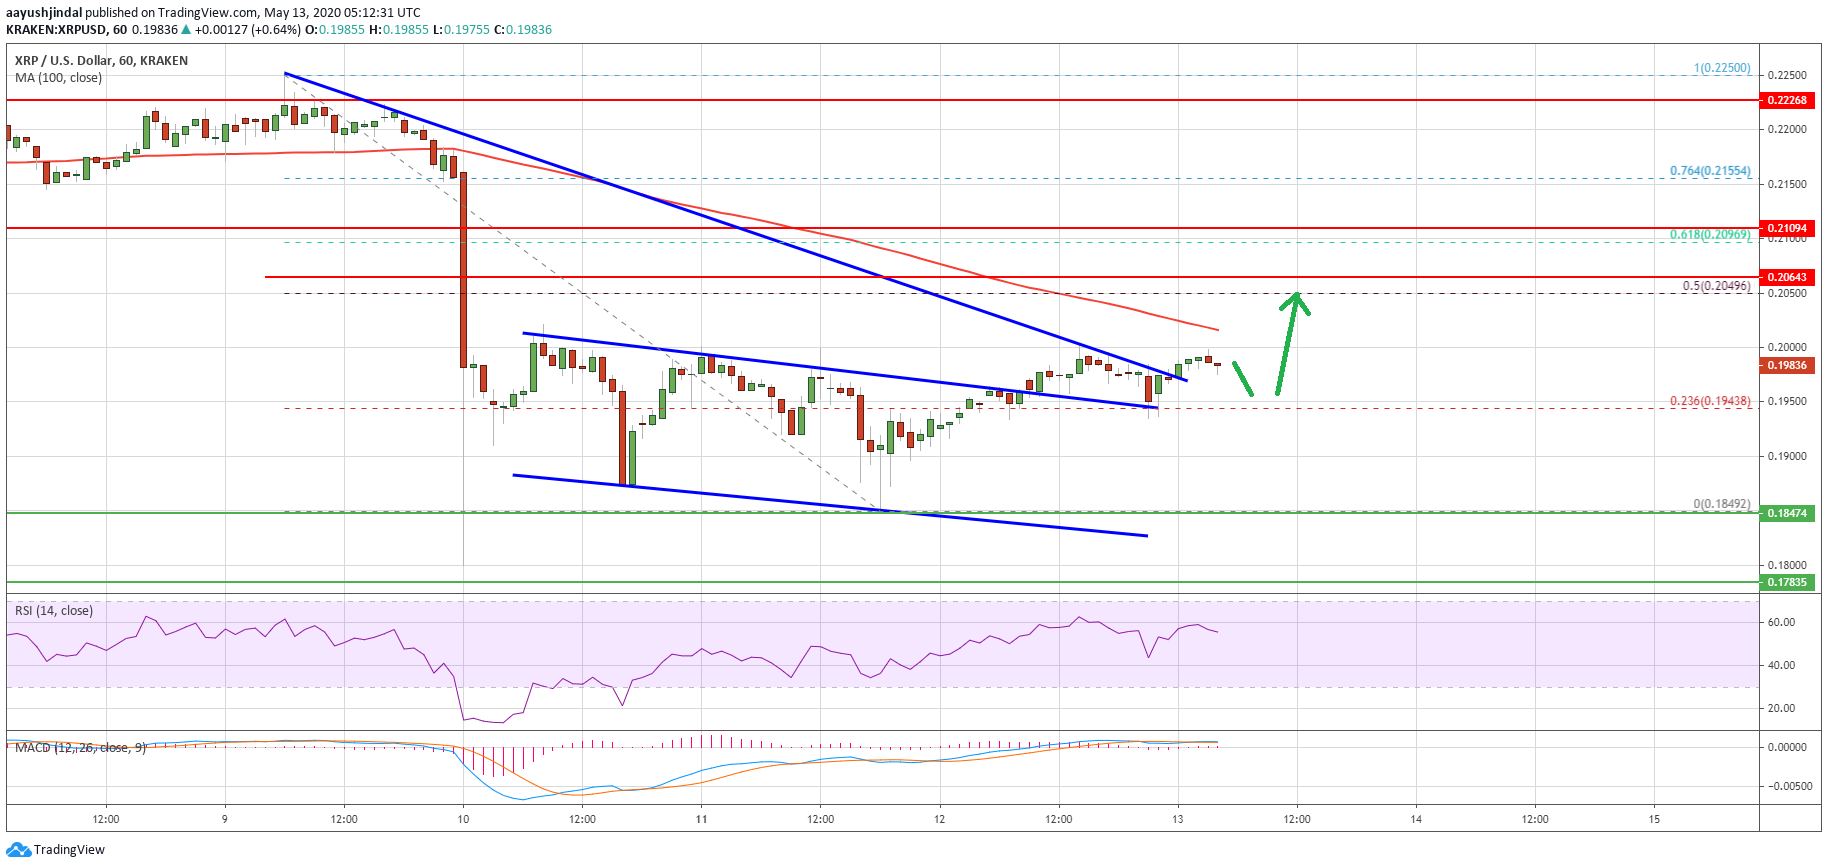
There was a clear break above the 23.6% Fib retracement level of the key drop from the $0.2250 swing high to $0.1850 low. More importantly, there was a break above a key bearish trend line with resistance near $0.1975 on the hourly chart of the XRP/USD pair.
Ripple is now trading above the $0.1950 level, but it is facing a couple of key hurdles near $0.2000. An initial resistance is near the 100 hourly simple moving average at $0.2010.
The first major resistance is near the $0.2050 level. It represents the 50% Fib retracement level of the key drop from the $0.2250 swing high to $0.1850 low. If XR price breaks the $0.2050 resistance zone, there are high chances of a sustained upward move.
The next major resistance is near the $0.2100 level, above which the bulls are likely to aim a test of the $0.2200 and $0.2220 levels in the near term.
U-turn in XRP?
If ripple fails to gain bullish momentum above the $0.1960 and $0.2000 resistance levels, there are chances of a fresh decline. An initial support is seen near the $0.1950 level.
The first major support is near the $0.1920 level, below which the price could struggle to stay above $0.1900. In the mentioned case, there is a risk of more downsides towards the $0.1850 and $0.1840 levels.
Technical Indicators
Hourly MACD – The MACD for XRP/USD is currently losing pace in the bullish zone.
Hourly RSI (Relative Strength Index) – The RSI for XRP/USD is correcting lower towards the 50 level.
Major Support Levels – $0.1920, $0.1900 and $0.1880.
Major Resistance Levels – $0.2000, $0.2040 and $0.2050.
Take advantage of the trading opportunities with Plus500
Risk disclaimer: 76.4% of retail CFD accounts lose money.


 Has Room to Rally Higher")