

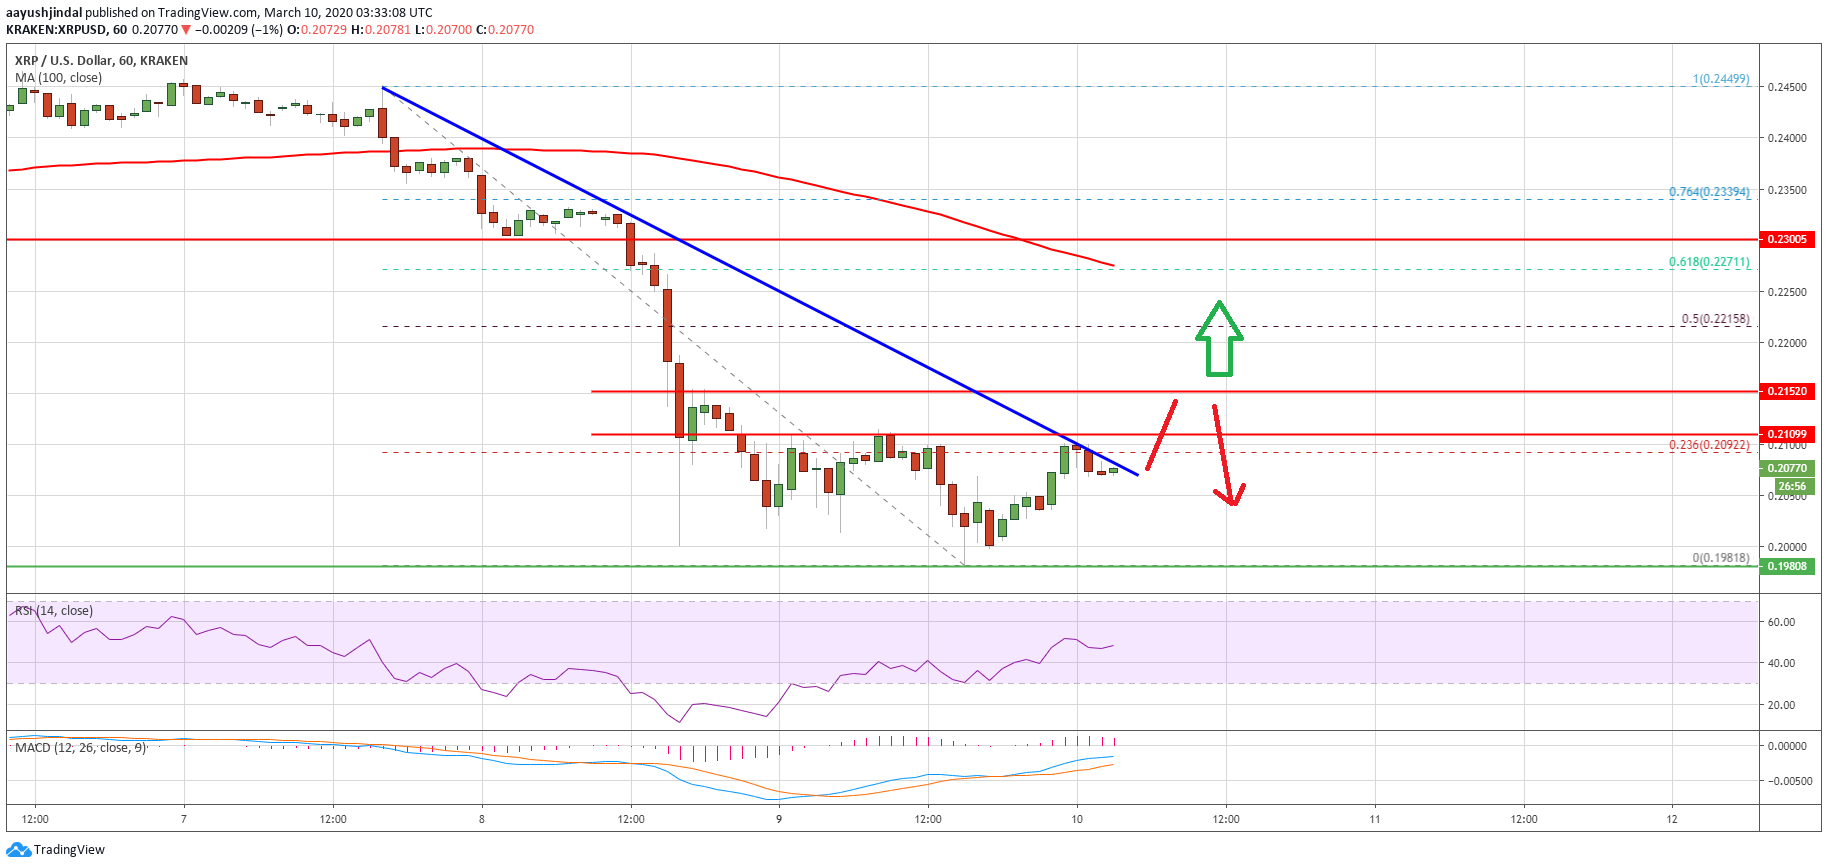
Ripple is currently correcting higher from the $0.1981 monthly low against the US Dollar. XRP price must break $0.2100 and $0.2150 to start a strong recovery in the near term.
- Ripple price is currently consolidating above the $0.2000 pivot level against the US dollar.
- The price is facing a lot of hurdles near the $0.2100 and $0.2150 levels.
- There is a key bearish trend line forming with resistance near $0.2085 on the hourly chart of the XRP/USD pair (data source from Kraken).
- The price could correct higher towards $0.2150, above which it might surge towards $0.2250.
Ripple Price Could Recover in the Short Term
Yesterday, we saw a sharp decline in ripple below the $0.2200 and $0.2050 support levels. XRP price even dived below the key $0.2000 support level and settled well below the 100 hourly simple moving average.
A new monthly low is formed near the $0.1981 level and the price is currently correcting higher. It is back above the $0.2000 level, but facing a lot of hurdles.
An initial resistance is near the 23.6% Fib retracement level of the recent drop from the $0.2450 high to $0.1981 low. More importantly, there is a key bearish trend line forming with resistance near $0.2085 on the hourly chart of the XRP/USD pair.
If there is an upside break above the trend line, ripple price might recover towards the $0.2150 resistance. A successful break above the $0.2150 level could start a strong recovery in the coming sessions.
The next major resistance is near the $0.2215 level since it is close to the 50% Fib retracement level of the recent drop from the $0.2450 high to $0.1981 low. Any further gains will most likely lead the price towards the $0.2280 resistance level and the 100 hourly SMA. An intermediate resistance is near the $0.2250 level.
Another Failure?
If ripple fails to correct above the $0.2100 and $0.2150 resistance levels, it is likely to resume its decline. An initial support is near the key $0.2000 pivot area.
A clear break and close below the $0.2000 support area may perhaps spark a sharp decline. The next support is near the $0.1981 low, below which there is a risk of a drop towards the $0.1920 level in the near term.
Technical Indicators
Hourly MACD – The MACD for XRP/USD is slowly moving in the bullish zone.
Hourly RSI (Relative Strength Index) – The RSI for XRP/USD is currently recovering and it is near the 50 level.
Major Support Levels – $0.2040, $0.2020 and $0.2000.
Major Resistance Levels – $0.2100, $0.2120 and $0.2150.


