

Ripple is showing a few positive signs above the $0.1550 resistance against the US Dollar. XRP price is likely to surge further if it clears the $0.1620 resistance area.
- Ripple price is up more than 6% and it traded above the key $0.1550 resistance against the US dollar.
- The bulls are now fighting to clear the $0.1620 and $0.1625 resistance levels.
- There was a break above a major bearish trend line with resistance near $0.1520 on the hourly chart of the XRP/USD pair (data source from Kraken).
- The price is likely to continue higher if it breaks the $0.1620 resistance area in the near term.
Ripple Price is Gaining Bullish Momentum
After forming a support base near the $0.1450 area, ripple started a fresh increase. XRP price is up more than 6% and it broke the $0.1500 and $0.1550 resistance levels.
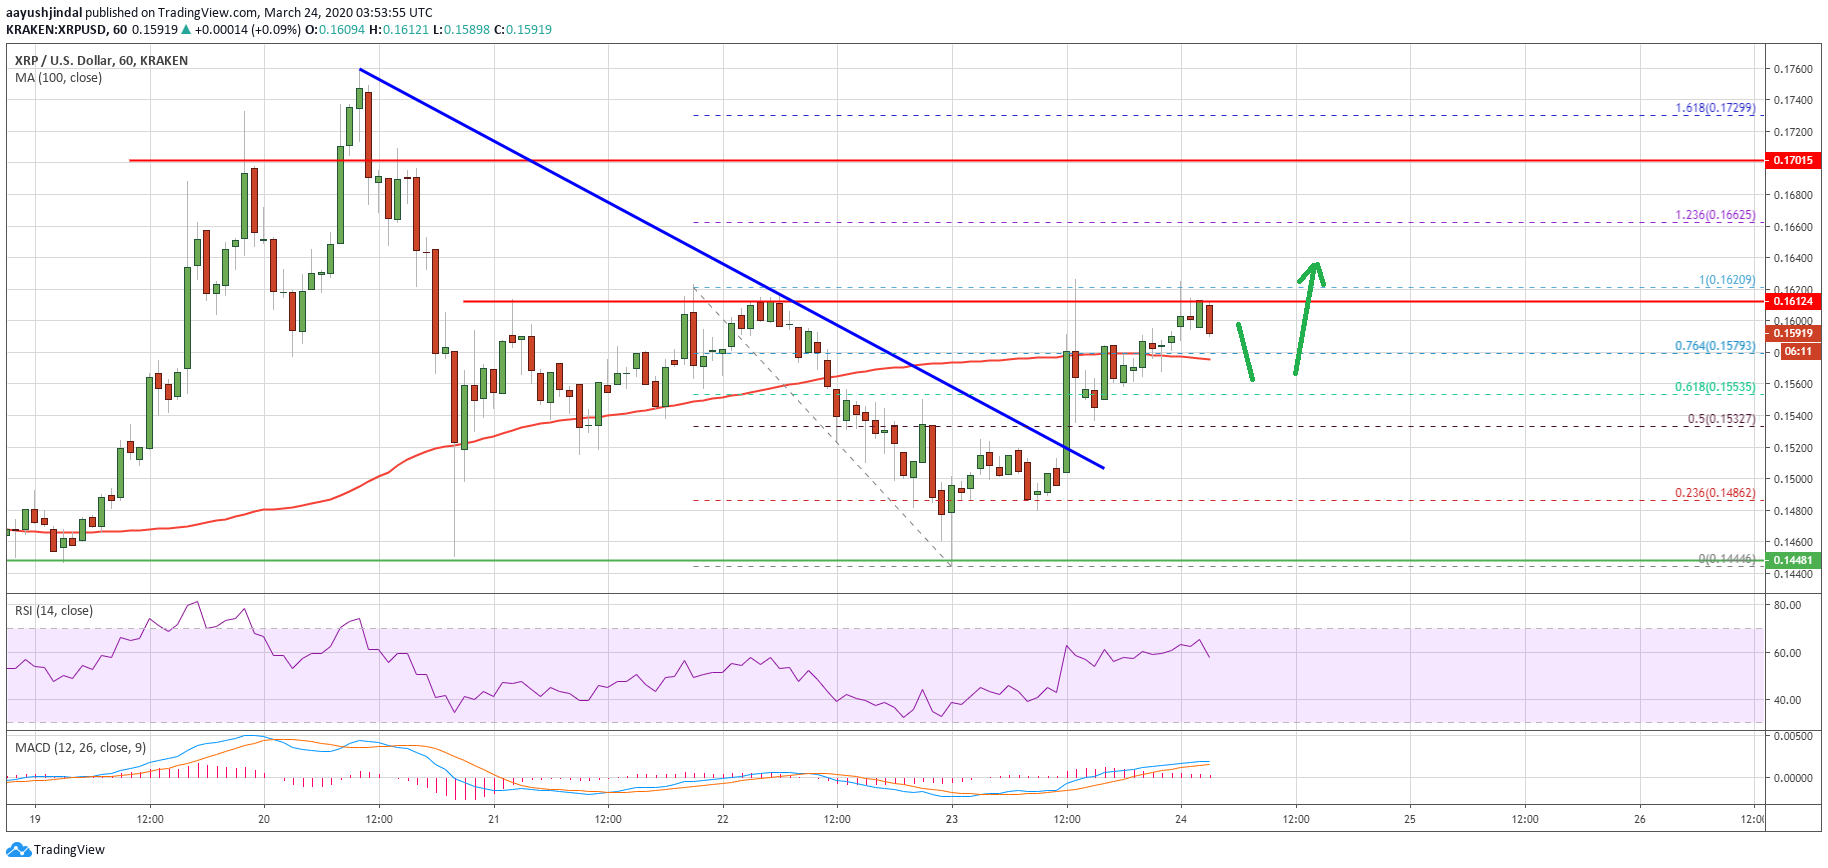
The upward move was strong as the price even surged above the $0.1580 resistance and the 100 hourly simple moving average. There was a break above the 76.4% Fib retracement level of the key drop from the $0.1620 high to $0.1444 low.
More importantly, there was a break above a major bearish trend line with resistance near $0.1520 on the hourly chart of the XRP/USD pair. Ripple is now trading near the last pivot zone at $0.1620.
If the bulls gain pace above the $0.1620 resistance zone, it could continue to rise in the near term. An immediate resistance is near the $0.1662 level. It coincides with the 1.236 Fib extension level of the key drop from the $0.1620 high to $0.1444 low.
Any further gains is likely to lead the price towards the $0.1700 resistance area in the coming sessions. The next major hurdle is seen near the $0.1720 level.
Another Rejection?
If ripple fails to continue above the $0.1620 resistance, it could start a fresh decline. An initial support is near the $0.1575 level and the 100 hourly simple moving average.
If the bulls fail to keep the price above the 100 hourly SMA, there is a risk of more losses below the $0.1550 support level. The next key support is near the $0.1520 level, below which it could revisit $0.1500.
Technical Indicators
Hourly MACD – The MACD for XRP/USD is slowly losing momentum in the bullish zone.
Hourly RSI (Relative Strength Index) – The RSI for XRP/USD is currently correcting lower from the 65 level.
Major Support Levels – $0.1575, $0.1520 and $0.1500.
Major Resistance Levels – $0.1620, $0.1660 and $0.1700.

 Holds Strong Above $40, Will The Crypto Pullback Affect It?")
