

Ripple is following a bullish path above the $0.2320 support zone against the US Dollar. XRP price is likely to accelerate higher above the $0.2400 and $0.2420 resistance levels.
- Ripple price is slowly climbing higher above the key $0.2350 level against the US dollar.
- The price is likely to gain bullish momentum above $0.2380 and $0.2400 in the near term.
- There is a major bullish trend line forming with support near $0.2330 on the hourly chart of the XRP/USD pair (data source from Kraken).
- The price remains well supported on dips near the $0.2350 and $0.2320 levels.
Ripple Price Eyeing Fresh Increase
Ripple made another attempt to surpass the $0.2380 resistance level, but it failed. XRP price corrected lower below $0.2350 and the 100 hourly simple moving average.
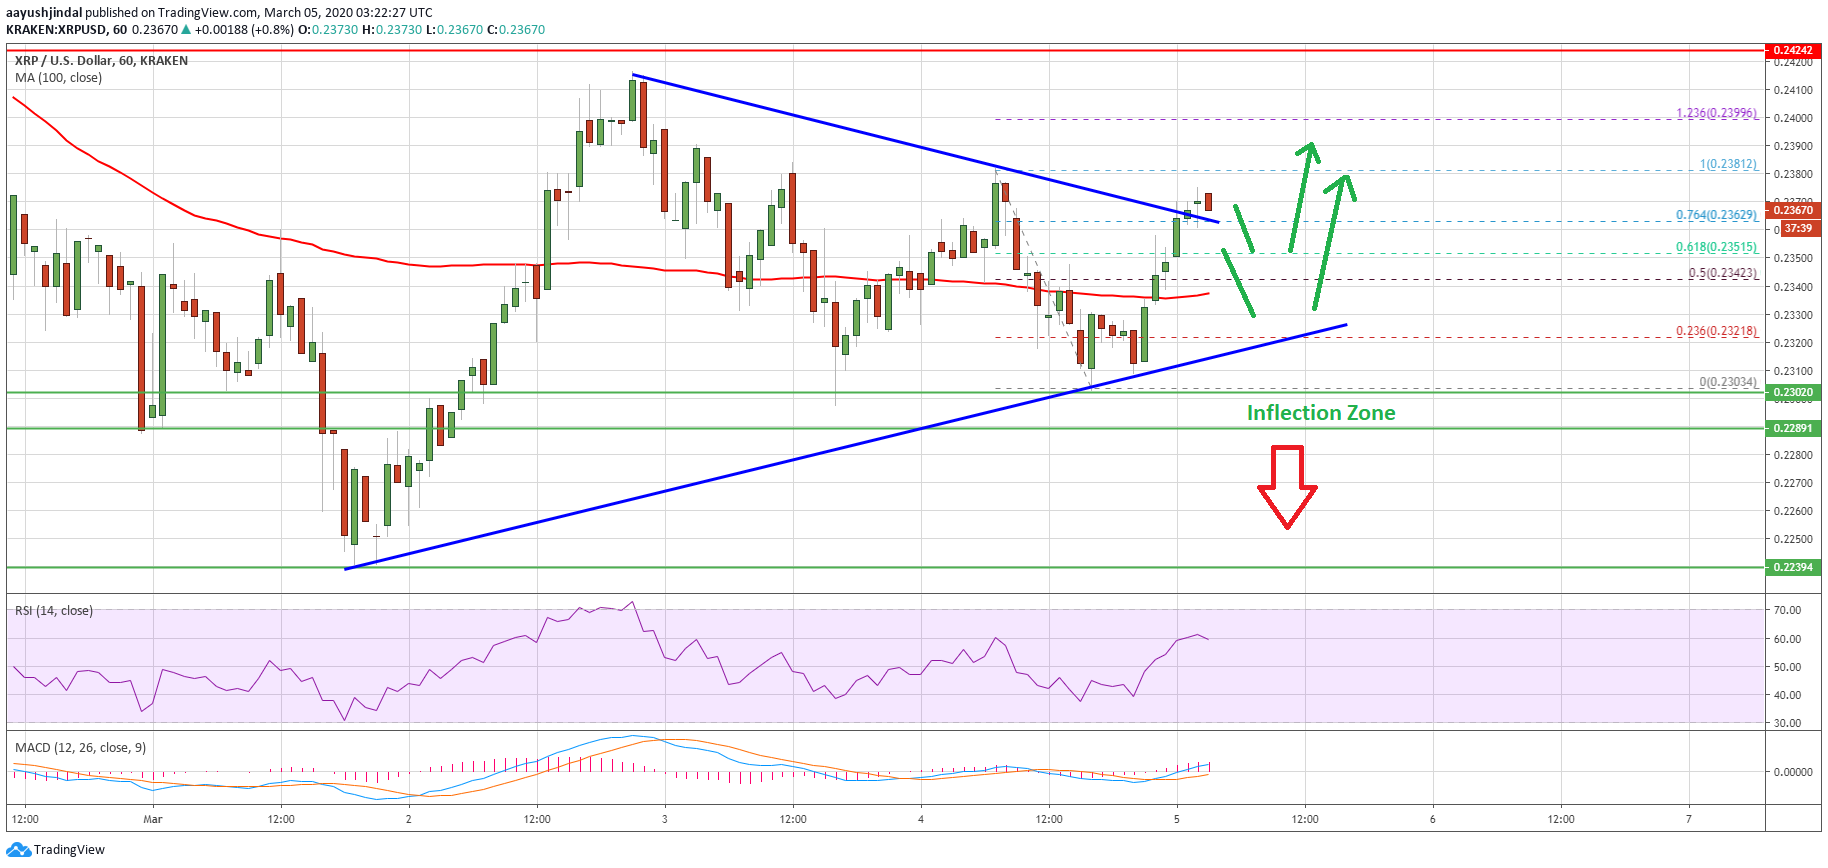
A low is formed near $0.2303 and the price is again rising. It is trading above the $0.2350 resistance and the 100 hourly simple moving average. Moreover, there was a break above the 50% Fib retracement level of the recent decline from the $0.2381 high to $0.2303 low.
Ripple is now trading nicely above the $0.2360 level and a connecting bearish trend line. On upside, the price is facing a couple of hurdles near the $0.2380 and $0.2400 levels.
On the downside, there is a major bullish trend line forming with support near $0.2330 on the hourly chart of the XRP/USD pair. If the pair starts a fresh increase above the $0.2380 resistance, there are high chances of a strong bullish wave above the $0.2400 and $0.2420 levels.
A successful break above the $0.2420 resistance area will most likely confirm a bullish break. In the mentioned case, the price is likely to surge higher towards the $0.2500 and $0.2550 levels in the near term.
Another Rejection?
If ripple fails to continue above the $0.2380 and $0.2400 resistance levels, it could decline again. An initial support is near the $0.2340 level and the 100 hourly simple moving average.
A bearish break below the 100 hourly simple moving average and the bullish trend line at $0.2320 may perhaps spark a strong negative move. The main support is still near $0.2300, below which there is a risk of more losses towards the $0.2240 level.
Technical Indicators
Hourly MACD – The MACD for XRP/USD is now showing positive signs in the bullish zone.
Hourly RSI (Relative Strength Index) – The RSI for XRP/USD is currently correcting lower towards the 50 level.
Major Support Levels – $0.2340, $0.2320 and $0.2300.
Major Resistance Levels – $0.2380, $0.2400 and $0.2420.


