
- Ripple price climbed higher recently above the $0.2450 and $0.2500 resistances against the US dollar.
- The price is currently trading near the $0.2620 resistance area and is consolidating gains.
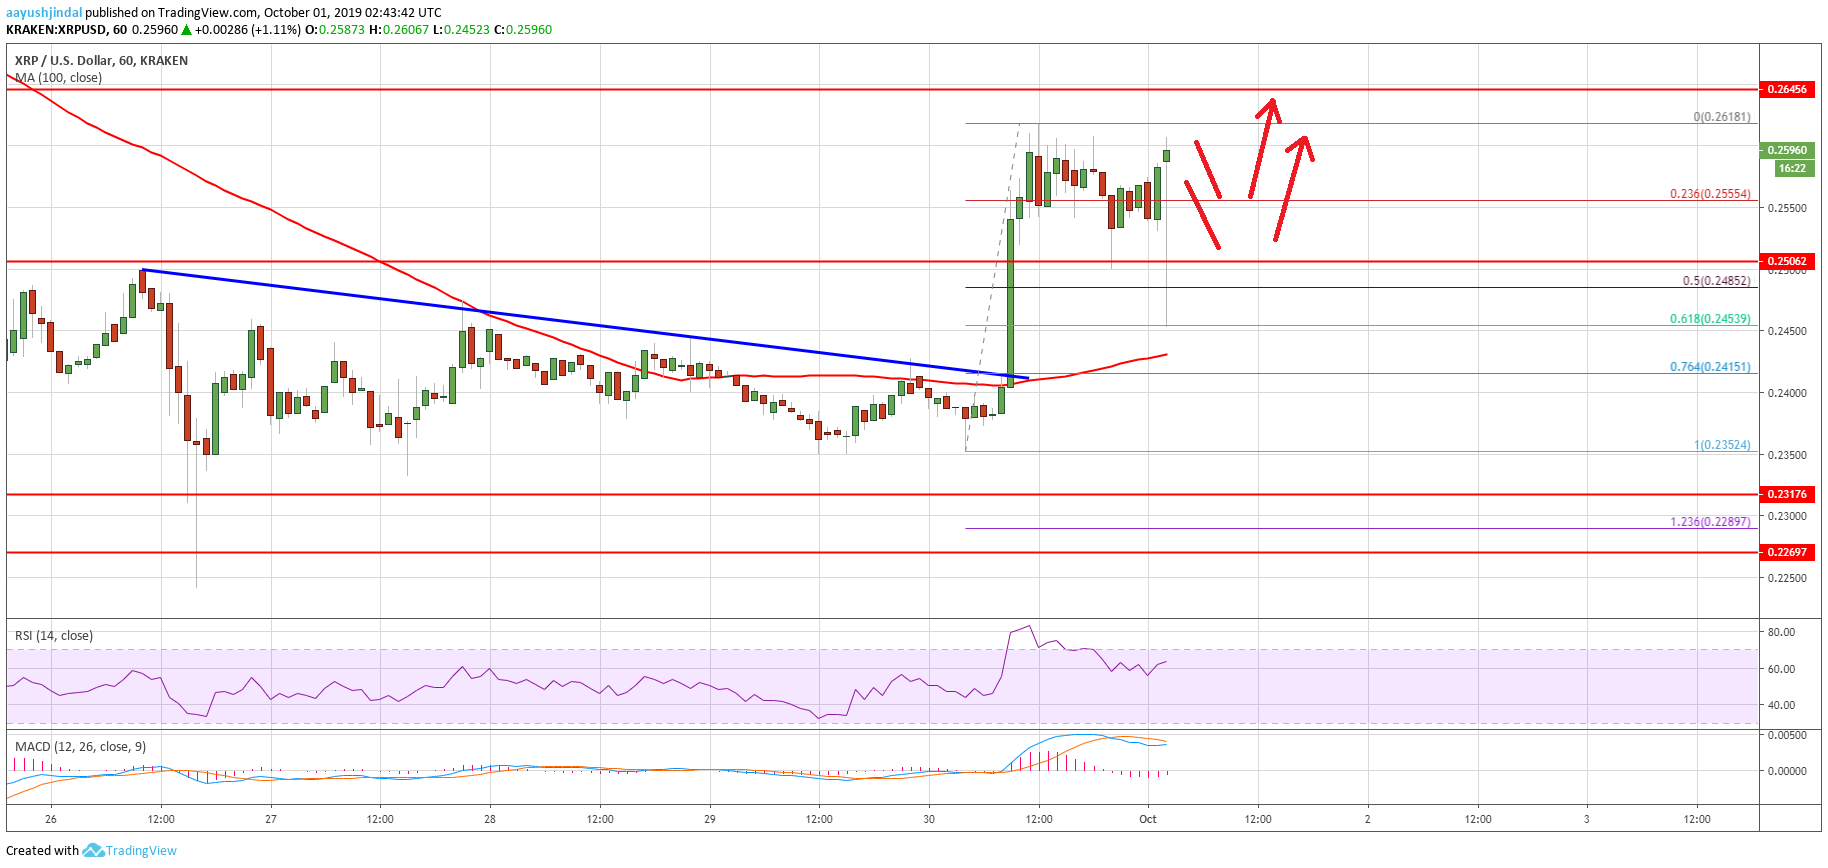
- There was a break above a major bearish trend line with resistance near $0.2415 on the hourly chart of the XRP/USD pair (data source from Kraken).
- The price might correct a few points, but it is likely to test the main $0.2650 resistance in the near term.
Ripple price is showing signs of a decent upside correction against the US Dollar and bitcoin. XRP price could continue higher, but the $0.2650 resistance holds the key.
Ripple Price Analysis
After a strong decline, ripple price started consolidating above the $0.2320 level against the US Dollar. The XRP/USD pair traded in a range and recently started a decent upward move above the $0.2400 resistance area. Moreover, the price broke the key $0.2420 resistance area and the 100 hourly simple moving average to start the recent upside correction.
During the rise, there was a break above a major bearish trend line with resistance near $0.2415 on the hourly chart of the XRP/USD pair. As a result, the pair surged above the $0.2500 and $0.2550 resistance levels. Ripple is up around 10% in the past three sessions and it even tested the $0.2620 resistance area. A high was formed near $0.2618 and the price is currently showing a lot of positive signs.
It dipped a few points below the $0.2600 level and the 23.6% Fib retracement level of the recent wave from the $0.2352 low to $0.2618 high. However, the decline was limited and contained by the $0.2480 support area. Moreover, the 50% Fib retracement level of the recent wave from the $0.2352 low to $0.2618 high acted as a strong support.
The price is now trading with a positive bias above the $0.2500 level. If there is an upside break above the $0.2620 resistance area, the price could test the main $0.2650 resistance. A clear break above the $0.2650 resistance area might set the pace for a larger upward move in the coming sessions. On the downside, the key supports are near the $0.2480 and $0.2450 levels.
Looking at the chart, ripple price is trading nicely above $0.2500. However, the bulls need to gain strength above the $0.2620 and $0.2650 resistance levels to push the price further higher in the near term.
Technical Indicators
Hourly MACD – The MACD for XRP/USD is about to move back into the bullish zone.
Hourly RSI (Relative Strength Index) – The RSI for XRP/USD is currently well above the 50 level.
Major Support Levels – $0.2520, $0.2480 and $0.2450.
Major Resistance Levels – $0.2620, $0.2650 and $0.2720.


