
Analysis
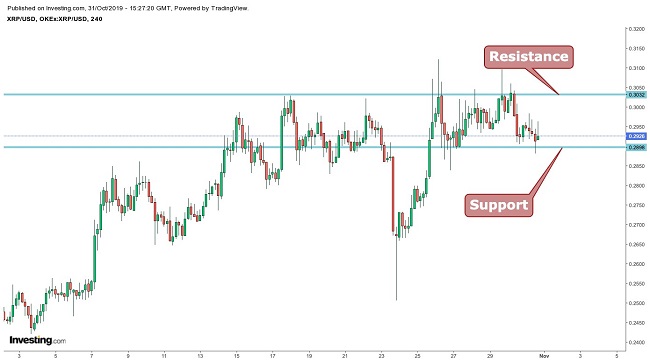
When looking at the chart below, we can see that Ripple (XRP)trade is trading at $0.294. It can also be observed that the cryptocurrency price is still trading inside the channel and is expected to do so for some time.
Therefore, it is suggested to do swing trading. The current resistance is at $0.3032 and support at $0.289. The digital currency is currently trading with neutral sentiments.
Dow Theory
According to the Dow Theory, the XRP price is prsently appearing in the public participation Phase. During this phase the market catches on to new investors; a rapid price change can occur and when it does occur, trend followers and other technically oriented investors join in and participate.

Bollinger Bands
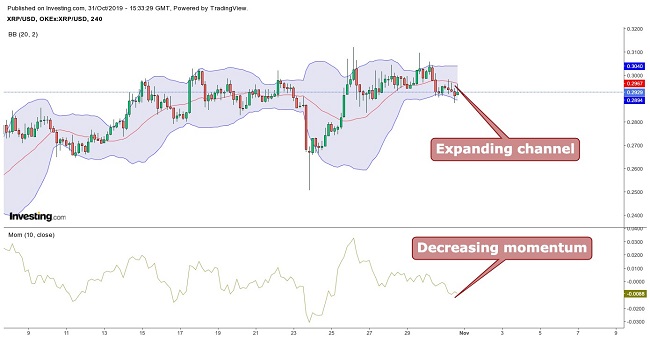
Ripple’s price is moving between the channels with the lower channel limit acting as support and the upper limit as resistance. The channel is expanding, which indicates increased volatility but the momentum is negative; that points out to a downtrend so we might see a further correction.

Moving Average
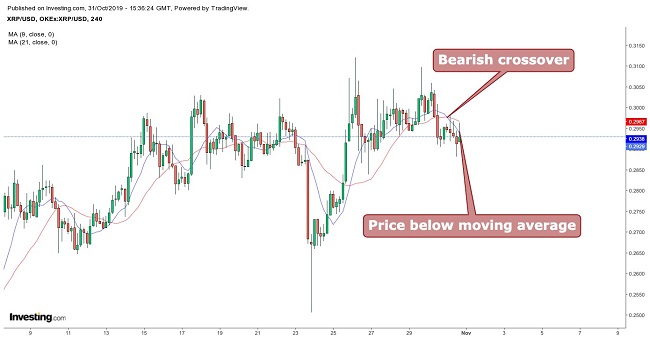
When taking 9 period moving averages (blue) with 21 period moving averages (red), a bearish crossover is seen with the price trading below the 9 and 21 period moving averages. This indicates a bearish sentiment so it is suggested to take positions only around the support level and the target at the resistance level.
Conclusion
Looking at the Ripple (XRP)trade price, we see that the virtual coin is trading at $0.294. The current resistance is at $0.3032 and support is at $0.289. The digital coin is overall trading with neutral sentiments.
Swing trading can be done by taking long positions near the support and keeping the target price near the resistance. Stop loss can be placed just below the support. Risk takers can take long positions at the current price, while risk averse investors can take long positions around support.
A close above $0.30 can take the price above $0.33 and a close below $0.28 can drag price down to the $0.26 levels.
Pivot Points
| Name | S3 | S2 | S1 | Pivot Points | R1 | R2 | R3 |
| Classic | 0.1974 | 0.2240 | 0.2589 | 0.2855 | 0.3204 | 0.3470 | 0.3819 |
| Fibonacci | 0.2240 | 0.2475 | 0.2620 | 0.2855 | 0.3090 | 0.3235 | 0.3470 |
| Camarilla | 0.2768 | 0.2824 | 0.2881 | 0.2855 | 0.2993 | 0.3050 | 0.3106 |
| Woodie’s | 0.2014 | 0.2260 | 0.2629 | 0.2875 | 0.3244 | 0.3490 | 0.3859 |
Technical Indicators
| Name | Value | Action |
| RSI(14) | 46.394 | Neutral |
| STOCH(9,6) | 54.192 | Neutral |
| STOCHRSI(14) | 99.347 | Overbought |
| MACD(12,26) | -0.014 | Sell |
| ADX(14) | 28.657 | Neutral |
| Williams %R | -31.623 | Buy |
| CCI(14) | 71.8638 | Buy |
| ATR(14) | 0.0396 | Less Volatility |
| Highs/Lows(14) | 0.0000 | Neutral |
| Ultimate Oscillator | 50.534 | Neutral |
| ROC | -5.357 | Sell |
| Bull/Bear Power(13) | 0.0138 | Buy |