

Meager Christmas Gifts for Bitcoin Price in 2019 – How About the New Year?
December 30, 2019 by Ramiro Burgos
In the end, there was a slight Christmas bump in the bitcoin price, but not the run investors had asked Santa for. The lateral trend has activated bullish signals, but BTC remains in similar territory to the past few months. How could that change? Read our weekly technical analysis to find out more.
Also read: Bitcoin Price Gathering Pace: $8K or More by Christmas?
Bitcoin Price Technical Analysis
Long-Term Analysis
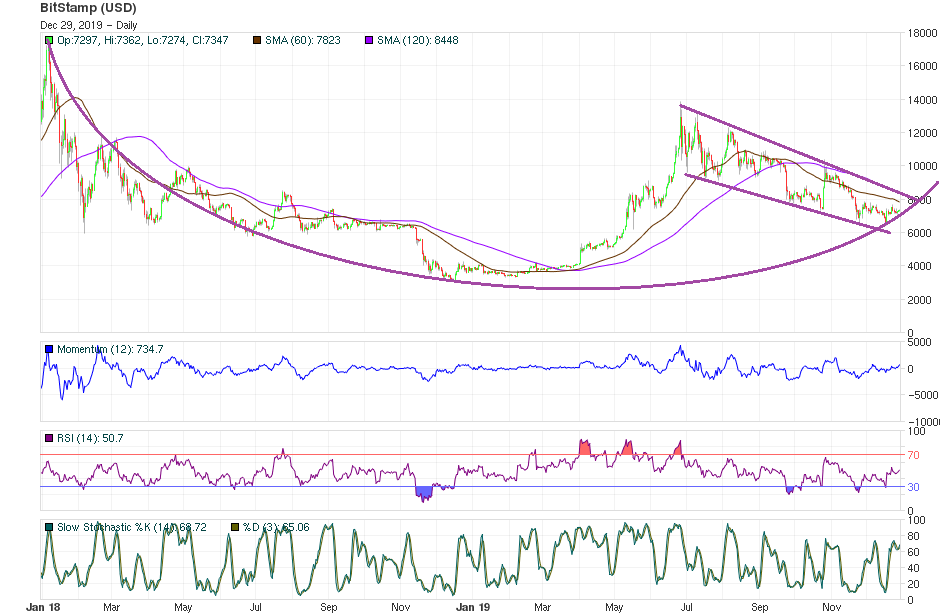
The current sideways movement is about to cross a recognized ascending curve of a Rounded Bottom Formation at $7,000, harming the grounds for a rise to higher levels.
According to Mass Psychological Analysis, even a Hope phase could give way to Optimism (depending on News and political factors) and any bound would follow a chain reaction of positive signals that had already begun. The delay of a hard announced rise by social network opinion leaders to the next resistance at $9,000 hasn’t happened so far.
On the other hand, If quotes keep going lateral, walking away from the curve, they could lose strength and fall to next support calculated near $6,000.
Mid-Term Analysis
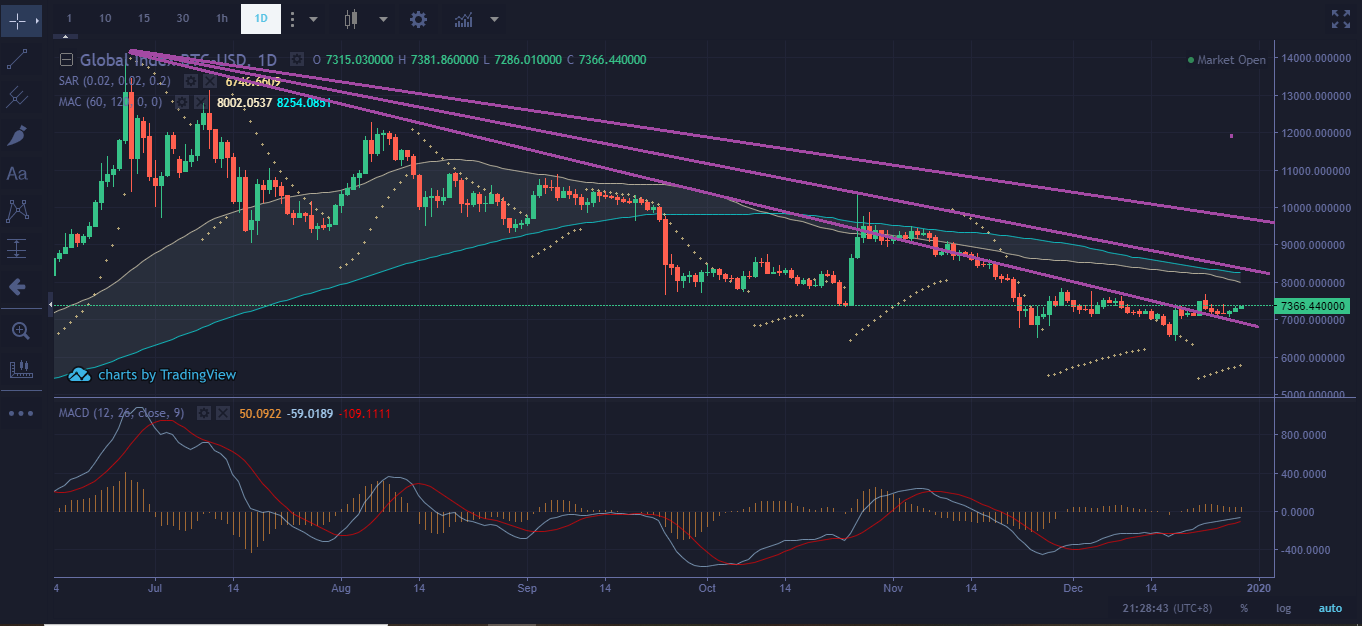
Volatility and technical signals keep reflecting a delayed bullish scenario, but even many mathematical indicators have covered half the ground to their top limits, so quotes can’t find the way to go higher.
Fibonacci Fan Lines’ first trigger was activated a week ago, favoring the values to march upwards to $8,500, and if that confirms it could synchronize prices and bullish indicators with an upward rally. However every rise attempt has faced a hard distribution activity, which would weaken the trend to drive it down again.
Short-Term Analysis
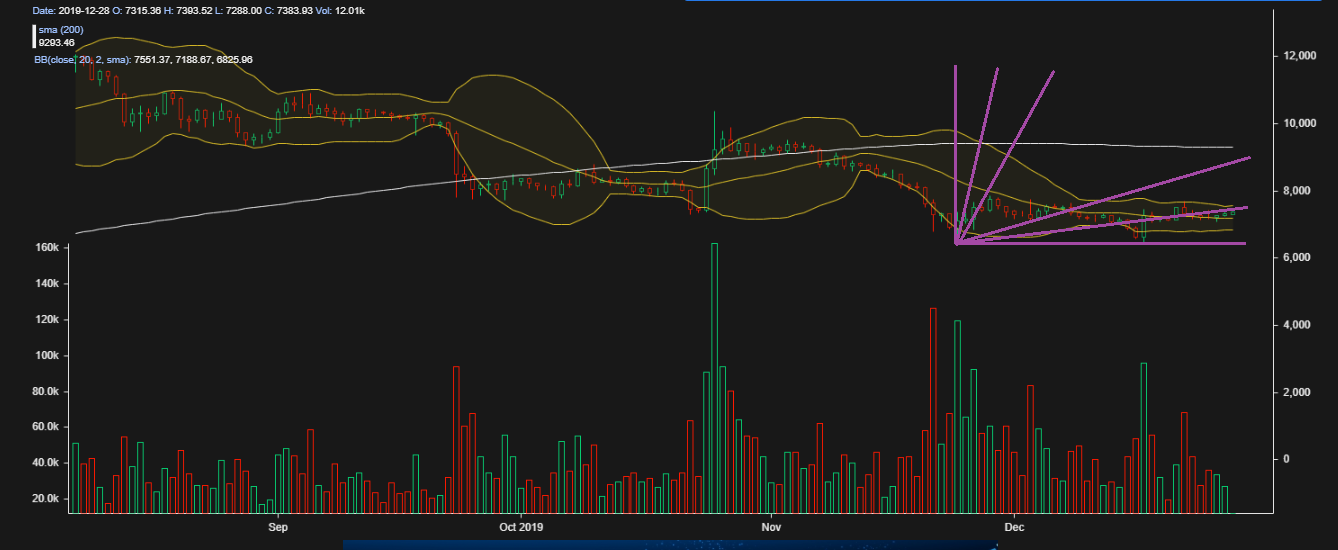
Following Japanese Candlestick Fairy examples, Demand Soldiers seem to be ready to clash with the Crows by crossing the Bollinger Bands’ center line at $7,000 in the lower bound of the march into the imaginary battlefield settled between $8,000 and $12,000. If this action confirms, Demand could prevail in the upward movement with logistic supplies from bullish technical tools.
Gann Angles’ theoretical next stage on the way up is still controlled by Offer’s distributors, and if the lateral activity continues, support can be considered at $6,000.
What do you think will happen to the bitcoin price? Share your predictions in the comments below.
If you find Ramiro’s analyses interesting or helpful, you can find out more about how he comes to his conclusions by checking out his primer book, the Manual de Análisis Técnico Aplicado a los Mercados Bursátiles. The text covers the whole range of technical analysis concepts, from introductory to advanced and everything in between. To order, send an email to [email protected]

Images via Pixabay, Ramiro Burgos
This technical analysis is meant for informational purposes only. Bitsonline is not responsible for any gains or losses incurred while trading bitcoin.


