In this episode of NewsBTC’s daily technical analysis videos we are looking at MATIC following a more than 10% intraday move on the back of the announcement that META would use Polygon for Instagram NFTs.
Take a look at the video below:
VIDEO: Polygon Price Analysis (MATICUSD): November 3, 2022
MATIC Gives Golden Cross Signal On Daily
Technical indicators on the daily chart exhibit strength relative to the rest of the crypto market. For example, price is above the mid-Bollinger Band and tagging the upper band; it is well above the Ichimoku cloud, the tenkan-sen and kijun-sen; it has struck the Parabolic SAR; and pushed above the 50, 100, and 200-day moving averages.
Most importantly, there is a golden cross on the daily. The last time there was a daily golden cross on MATICUSD, the cryptocurrency rallied by more than 13,000%.
The Bollinger Bands are the tightest in five years | Source: MATICUSD on TradingView.com
Related Reading: Bitcoin And The Dollar Reach Inverse Inflection Points | BTCUSD November 1, 2022
Elliott Wave Theory Hints At Coming Polygon Rally
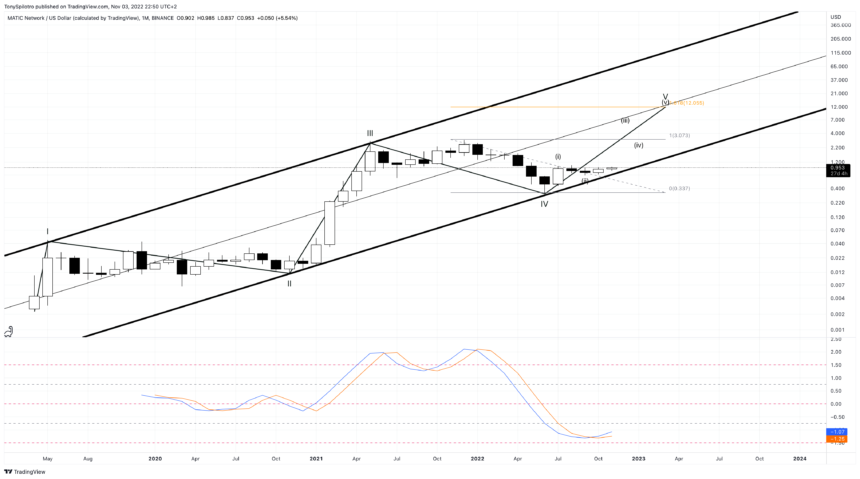
Low timeframe Elliott Wave Theory counting could suggest that MATIC has finished its wave 1 impulse and possibly a wave 2 correction, before it begins a larger move higher for a wave 3, 4, and 5. Adding in a channel shows that if this is the start of wave 3 of 5, the end of the 5th wave could terminate at the mid-point of the channel.
The channel appears valid throughout a series of different timeframes. On monthly timeframes, turning on the Fisher Transform shows a bullish crossover in the months past that could begin to pick up steam.