

Litecoin price is gaining momentum above $62.00 against the US Dollar. LTC is likely to continue higher (similar to bitcoin), and it could even break the $65.00 resistance in the near term.
- Litecoin formed a strong support base near $57.00 and started a fresh increase against the US Dollar.
- The price is now trading nicely above the $60.00 level and the 100 simple moving average (4-hours).
- There was a break above a major contracting triangle with resistance near $60.00 on the 4-hours chart of the LTC/USD pair (data feed from Kraken).
- The price is likely to continue higher above the $64.00 and $65.00 resistance levels.
Litecoin Price Starts Fresh Increase
This week, bitcoin price gained pace above the $15,500 and $16,000 resistance level, sparking positive moves in altcoins. Litecoin performed really well, and it started a decent upward move after forming a support base near the $57.00 level.
LTC price broke the $58.50 and $60.00 resistance levels to move into a positive zone. There was a break above the 50% Fib retracement level of the downward move from the $64.92 swing high to $57.00 swing low.
Moreover, there was a break above a major contracting triangle with resistance near $60.00 on the 4-hours chart of the LTC/USD pair. Litecoin price is now trading nicely above the $60.00 level and the 100 simple moving average (4-hours).
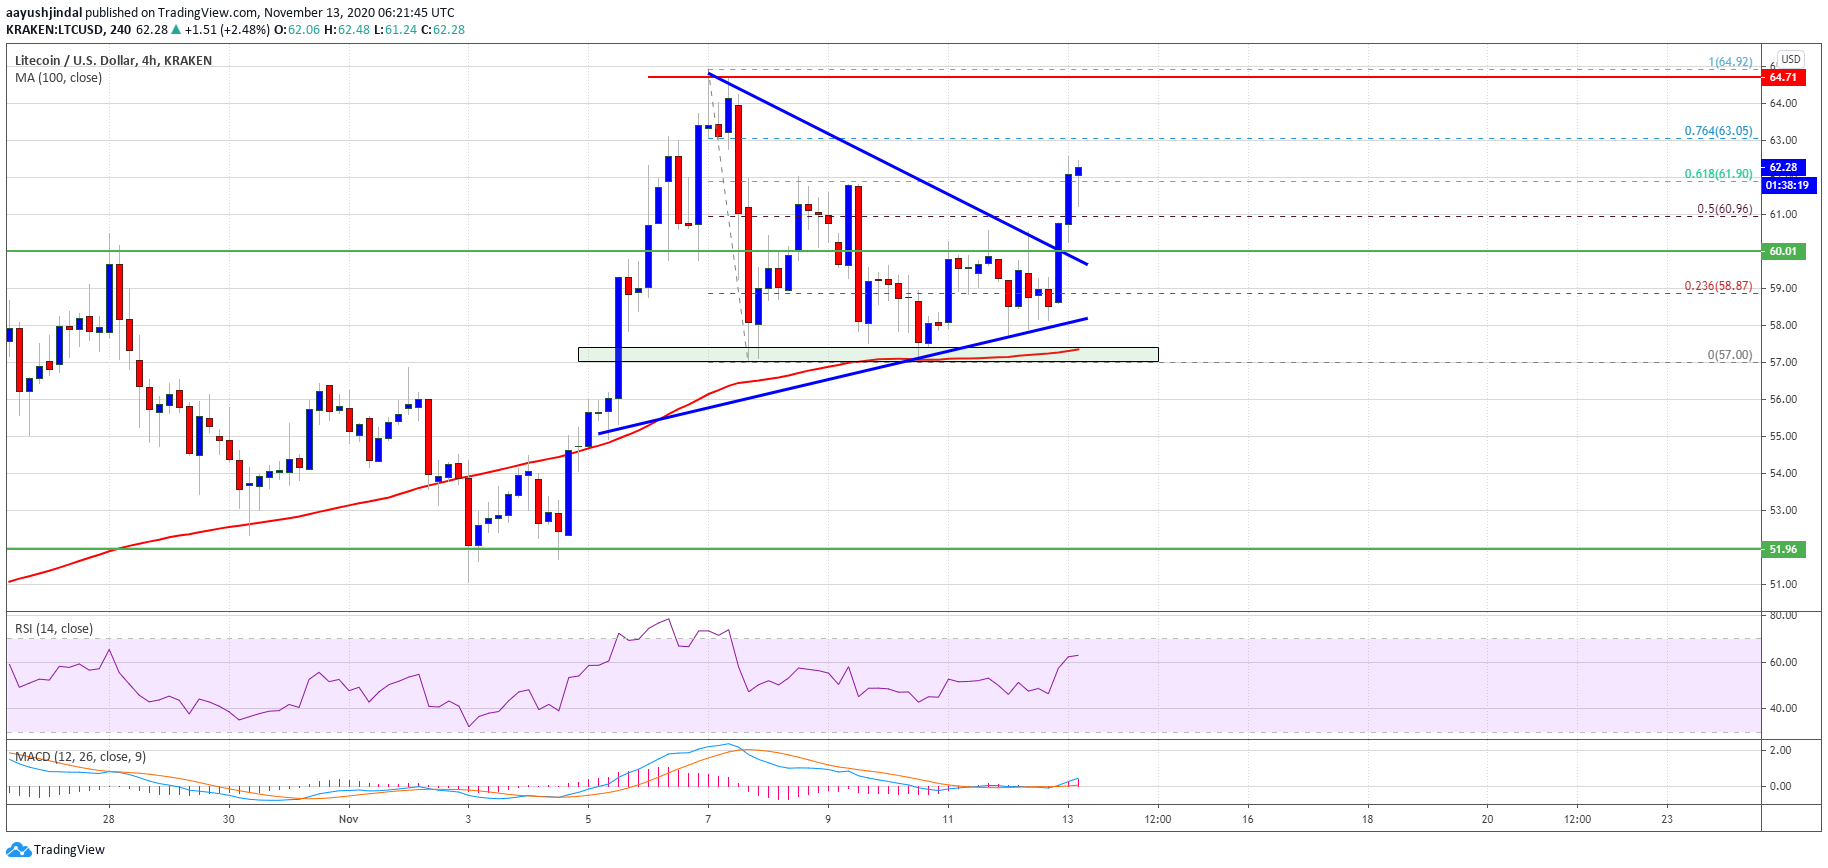
Source: LTCUSD on TradingView.com
An immediate resistance is near the $63.00 level or the 76.4% Fib retracement level of the downward move from the $64.92 swing high to $57.00 swing low. The first major resistance is near the $64.00 level.
The main resistance is near the $65.00 level. A successful break and close above the $65.00 resistance may perhaps open the doors for a decent increase towards the $70.00 resistance.
Dips Likely Limited in LTC
If litecoin fails to continue above the $63.00 resistance or the $65.00 zone, there are chances of a downside correction. On the downside, the first major support is near the $60.00 region (the recent breakout zone).
The main support is now forming near the $57.00 level and the 100 simple moving average (4-hours), below which the price could test $55.00.
Technical indicators:
4-hours MACD – The MACD is now gaining momentum in the bullish zone.
4-hours RSI (Relative Strength Index) – The RSI for LTC/USD is currently rising and it is well above the 50 level.
Major Support Levels – $60.00 followed by $57.00.
Major Resistance Levels – $63.00 and $65.00.


