
Analysis
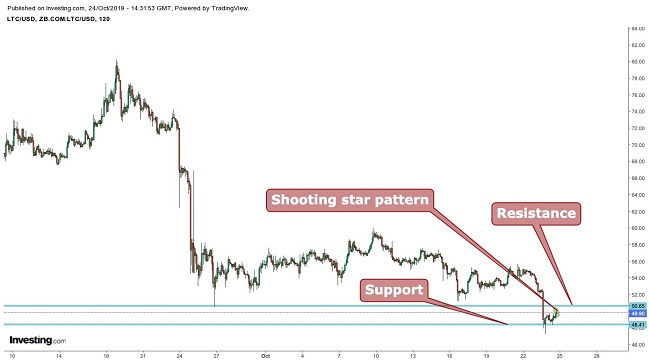
When looking at the chart below, we can see that Litecoin (LTC)trade is currently trading at $50.07. The cryptocurrency price has broken out of the channel and broken the support of $52 and found a new support at $48 with resistance at $ $50.5.
Litecoin’s price is trading around its support level and we see formation of a shooting star pattern which is bearish reversal pattern. So the price is expected to touch the support again. Long position can be taken around support for swing trading.
Dow Theory
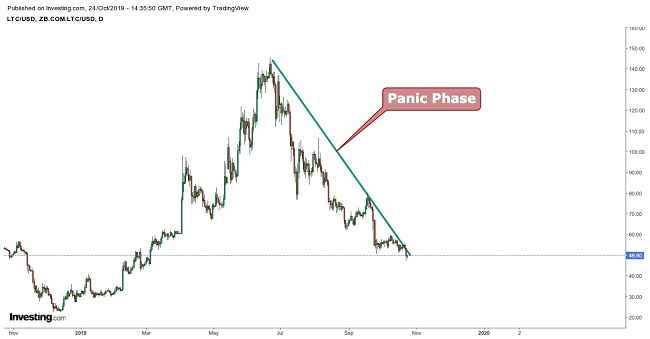
According to Dow Theory, the LTC price is in the panic phase. In this phase, distressed selling takes over from those who believe that the worst is yet to come or are forced to liquidate. This phase is followed by the accumulation phase in which informed investors take long positions.
Bollinger Bands
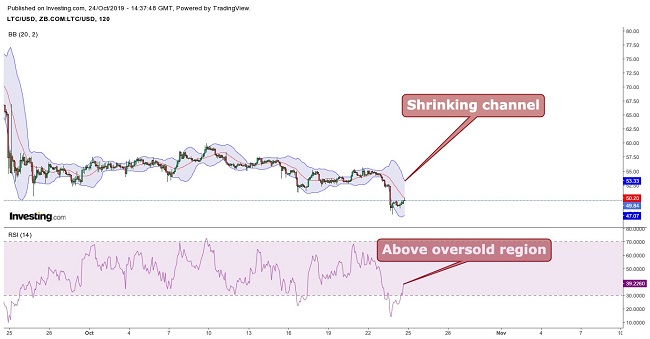
The price is moving between the channels with the lower channel limit acting as support and the middle average line acting as resistance. It is clearly observed that the channel is shrinking after expansion and the RSI is above the oversold region. This indicates decreased volatility with neutral sentiments, so the price might be stuck between the channels.

Moving Average
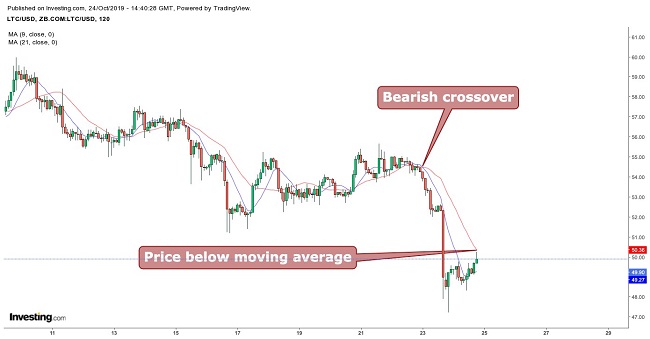
When taking 9 period moving averages (blue) with 21 period moving averages (red), a bearish crossover is seen; yet, Litecoin’s price is moving above the 9 period moving average and below the 21 period moving average.
This indicates a room for an uptrend, but only after some positive sentiments. Therefore, long positions can be taken after the price touches the support or breaks the resistance.
Conclusion
Looking at the present chart, we see that Litecoin (LTC)trade is currently trading at $50.07; the support level is at $48 with the resistance level at $ $50.5. The cryptocurrency’s price seems to be struck between the channels.
Swing trading can be done using the above mentioned levels. The price is expected to touch the support level again. Long position should not be taken at this price. A day close above $51 can again take the price back to the previous channel and level. A day close below support from here can drag the price below to $44 levels.
Pivot Points
| Name | S3 | S2 | S1 | Pivot Points |
R1 | R2 | R3 |
| Classic | 44.370 | 47.770 | 50.736 | 54.136 | 57.102 | 60.502 | 63.468 |
| Fibonacci | 47.770 | 50.202 | 51.704 | 54.136 | 56.568 | 58.070 | 60.502 |
| Camarilla | 51.950 | 52.534 | 53.117 | 54.136 | 54.285 | 54.868 | 55.452 |
| Woodie’s | 44.152 | 47.661 | 50.518 | 54.027 | 56.884 | 60.393 | 63.250 |
Technical Indicators
| Name | Value | Action |
| RSI(14) | 35.611 | Sell |
| STOCH(9,6) | 20.074 | Sell |
| STOCHRSI(14) | 0.000 | Oversold |
| MACD(12,26) | -4.646 | Sell |
| ADX(14) | 31.240 | Sell |
| Williams %R |
-95.466 | Oversold |
| CCI(14) | -124.9325 | Sell |
| ATR(14) | 12.1964 | Less Volatility |
| Highs/Lows(14) | -15.2374 | Sell |
| Ultimate Oscillator |
35.888 | Sell |
| ROC | -50.257 | Sell |
| Bull/Bear Power(13) |
-33.2540 | Sell |