

The Litecoin price has continued to face rejection after it failed to topple over the $80 price level. In the last 24 hours, it barely registered any price movement. It just depreciated by 0.8%. It was an indication of sideways trading for the altcoin.
The past week for LTC has been choppy owing to constant volatility amongst major market movers. Bitcoin has dropped in price over the last 48 hours, dragging most altcoins down with it. The technical outlook of the Litecoin price showed signs of struggle as the bears were still around.
Demand for LTC slowed down, as did the accumulation. Buyers have continued to sell short as and when LTC lost its local support. From the technical outlook, the Litecoin price may present shorting opportunities for traders at some levels.
For the coin to move on the upside, demand has to return in the market. Bitcoin has to move back above the $17,000 price level for most altcoins to gain momentum. The market capitalization of Litecoin declined in the last 24 hours, reflecting bearish pressure in the market at press time.
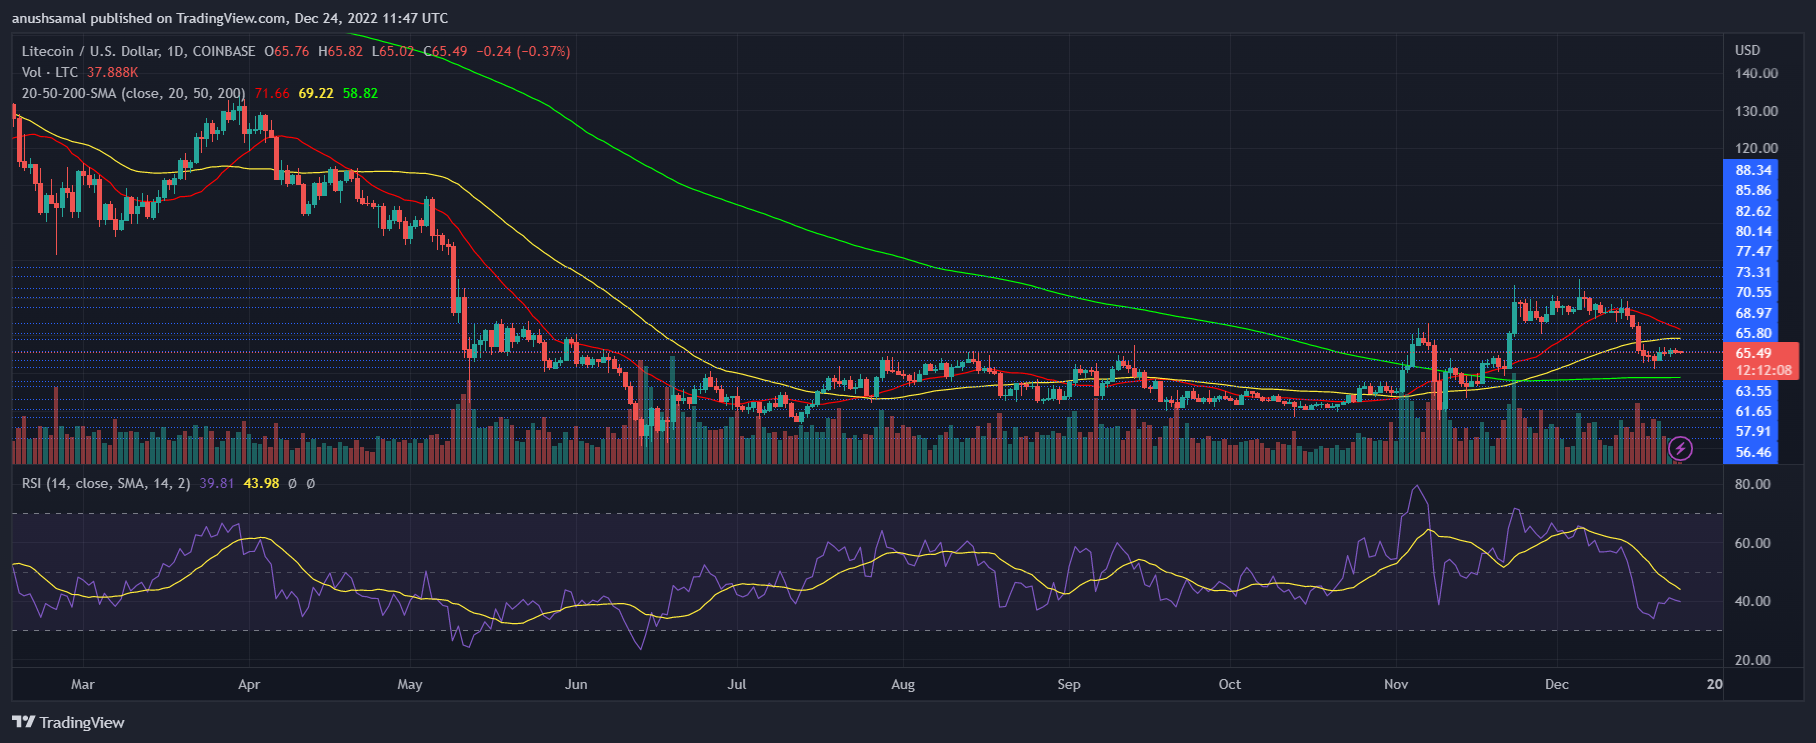
Litecoin Price Analysis: One-Day Chart
LTC was exchanging hands at $65 at the time of writing. Even though the coin is consolidating at the moment, it can lose its local support. The immediate resistance for the coin stood at $68, and clearing that level will take the coin to $73.
On the flip side, the inability to remain over $64 will bring the coin to $63 and then to $61. When the coin falls to $63 and then to $61, this would be a shorting opportunity for sellers as the coin will start correcting after that.
The amount of Litecoin traded in the last session was in red, which indicated bearishness and more selling in the market.
Technical Analysis
The buyers were in control of the price of the asset for most of December. With increased market price volatility and Litecoin price consolidation, there was increased liquidation, causing buying strength to decline.
The Relative Strength Index was near the 30-mark, which was a sign of overselling. In accordance with the selling pressure, the Litecoin price was below the 20-Simple Moving Average (SMA) line, and that meant sellers were driving the price momentum in the market.
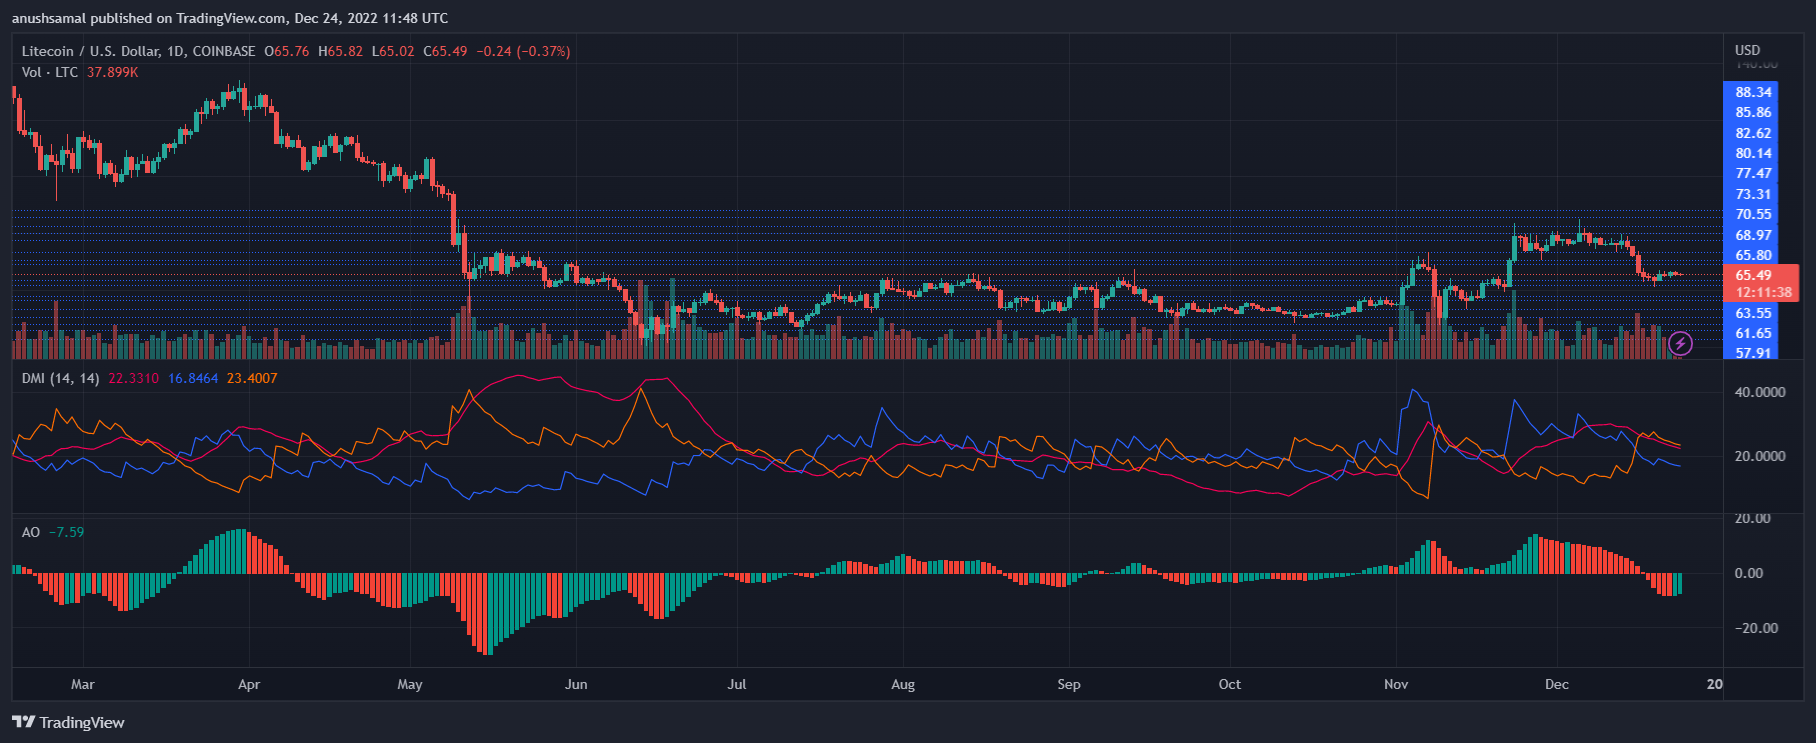
Sellers continue to have leverage in the market, but an indicator shows that buyers could step in now. The Awesome Oscillator (AO) reads the price trend and reversals within it. AO portrayed green histograms, which were buy signals for the coin.
If buyers act on it, the price of the altcoin can momentarily go up before it descends. The Directional Movement Index indicates the price direction of the asset.
DMI was negative as the -DI line (orange) was above the +DI line (blue). The Average Directional Index (red) was dipping near the 20-mark, meaning that the current price direction lacked strength.
Featured Image From UnSplash, Charts From TradingView.com


