

Bitcoin has been flashing some signs of technical weakness as it hovers above the lower boundary of its long-held trading range between $9,000 and $10,000.
Its inability to stabilize above the support that was previously established in the mid-$9,000 region does point to some underlying weakness amongst buyers.
The lower boundary of the cryptocurrency’s trading range also coincides closely with its crucial Ichimoku Cloud support.
Although this support has been defended thus far, a break below it leaves “open-air” for Bitcoin to reel lower.
One analyst is even noting that it doesn’t have any significant support until $7,000, signaling that its next decline could be quite far-reaching.
Bitcoin Struggles to Gain Momentum as It Hovers Above Crucial Support
At the time of writing, Bitcoin is trading down marginally at its current price of $9,130. This is around the level at which it has been consolidating throughout the past week.
Both buyers and sellers have been deadlocked as of late, leading the crypto to form one of the tightest trading ranges it has ever seen between $9,000 and $9,300.
Until one of these levels is broken and BTC moves to shatter its macro range between $9,000 and $10,000, its mid-term outlook will remain unclear.
This sideways trading has been further perpetuated by declining trading volume and liquidity, which has largely been siphoned into the altcoin market.
Until altcoins begin ceding their momentum, it is a strong possibility that Bitcoin will continue trading sideways.
One analyst is now noting that the cryptocurrency’s next significant movement could heavily favor bears if buyers are unable to guard against further losses.
While pointing to BTC’s Ichimoku Cloud formation, the analyst explained that there is “open-air” until $7,000 if it breaks below its current support.
“BTC – daily cloud support being respected…for the time being…lots of open air down to $7K,” he explained.
Image Courtesy of Big Chonis. Chart via TradingView.
This Indicator Suggests BTC’s Consolidation Phase is About to End
Investors and analysts alike may soon have greater clarity into the cryptocurrency’s next trend.
While pointing to Bitcoin’s Bollinger Bands, the same analyst noted that they haven’t been this tight since before the November 2018 meltdown that caused the crypto’s price to reel by 50%.
Which band BTC closes outside of first should offer insight into its next trend.
“BTC – It was Nov. ‘18 and the Daily BB’s had not been that tight in years…In the days that followed Bitcoin would fall 50%. We are once again at the same pinch, the first daily close outside either band should define the dominant trend direction,” he said.
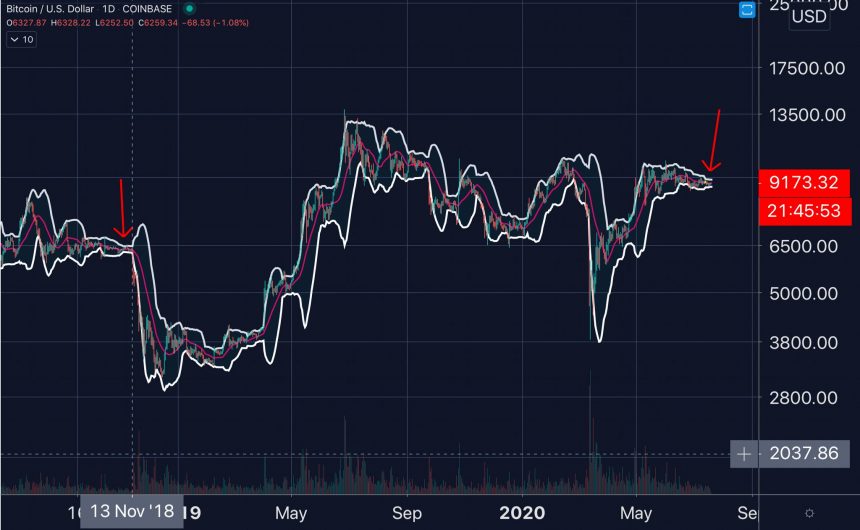
Image Courtesy of Big Chonis. Chart via TradingView.
The week ahead may ultimately prove to be a pivotal one for Bitcoin.
Featured image from Deposit Photos.

Charts from TradingView.


