

Less than a week ago on November 23 was Fibonacci Day. Not even a week later, a crucial ratio related to the Fibonacci Sequence and the Divine Proportion might have called the Bitcoin bottom near perfectly.
Could the current recovery across crypto be the “golden rally” that leads to the end of the bull cycle and new all-time highs?
So-Called “Bearish” Bitcoin Bounces At 0.618 Fibonacci Retracement Level
If you read the majority of tweets across crypto Twitter, they tend to lean bearish. At the same time, the crypto market Fear and Greed Index reached extreme fear, all while Bitcoin price trades at well above $50,000 per intangible digital coin.
To put this into perspective, a year and six months ago, the same sentiment saw BTC trading at under $4,000 for a brief moment on Black Thursday – it is a stretch to imagine a price tag of $50,000 more per coin to be “bearish.”
Related Reading | 10 Bullish Monthly Bitcoin Price Charts To Start November
The top cryptocurrency is also potentially well into a recovery, having bounced at a key level that may have prevented the asset from ever becoming bearish.
The chart below shows the Bitcoin daily bouncing precisely at the 0.618 Fibonacci retracement level. Friday’s Omicron-driven, post-Thanksgiving selloff paused exactly at the same level, as did the following Saturday close. After abruptly sweeping into the 0.618 level on Sunday, a recovery started to close out the weekly candle more than $3,000 higher.
Bitcoin price held at 0.618 and could target 1.618 next | Source: BTCUSD on TradingView.com
Why This Recovery Could Be “The Golden Rally”
Drawing Fibonacci levels is done from the swing high to swing low, or vice versa. Doing so from the mid-November peak to the June bottom, projected exactly where the rebound began (pictured above).
0.618 is closely related to the Golden Ratio, or 1.618. The number is also referred to throughout history as the Divine Proportion. Fibonacci Day is named for such because of the 11/23 date matching the start of the Fibonacci sequence, which consists of 1, 1, 2, 3, 5, 8, 13, 21, and so on.
Taking any number in the sequence beyond 5 and multiplying by 1.618 gives an approximation of the next closest number in the sequence. Multiply by 0.618 instead, and you’ll reduce the sequence. The ratios are found all over nature, art, music, even in outer space.
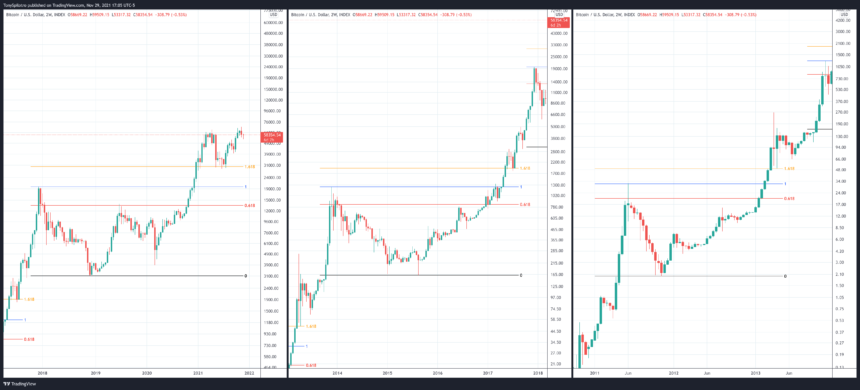
The Golden Ratio has acted as all mid-cycle bottoms. | Source: BTCUSD on TradingView.com
In Bitcoin, the Golden Ratio of 1.618 has acted as the over mid-cycle bottom the past three bull cycles and to this day remains unbroken. If comparing to the past cycles, the 0.618 retest is especially critical after the mid-cycle move. It is from this level that the final stages of the bull run unfold.
Related Reading | Want To Learn Technical Analysis? Read The NewsBTC Trading Course
Current projections of the Golden Ratio above here, and 2.618 above it, would put the peak of the Bitcoin cycle at around $94,000 and $135,000. 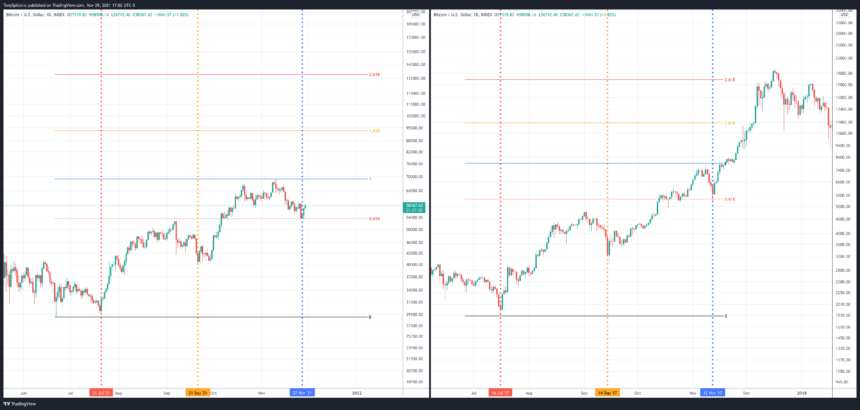
Targets would be between $90K and $140K | Source: BTCUSD on TradingView.com
But looking ahead toward 1.618 or higher requires 0.618 to hold and the current all-time high to be breached. At that point, Fibonacci extensions become potential areas of resistance – much like how retracement levels can act as support.
Here, we have potential for The Golden Rally to unfold. #Bitcoin #BTC pic.twitter.com/l47CnVEnAK
— Tony “The Bull” Spilotro (@tonyspilotroBTC) November 29, 2021
Follow @TonySpilotroBTC on Twitter or join the TonyTradesBTC Telegram for exclusive daily market insights and technical analysis education. Please note: Content is educational and should not be considered investment advice.
Featured image from iStockPhoto, Charts from TradingView.com


