

Bitcoin gained more than 2.5% and broke the main $9,300 resistance against the US Dollar. BTC is currently consolidating gains and it is likely setting up for more upsides towards $9,550.
- Bitcoin gained bullish momentum above the $9,200 and $9,300 resistance levels.
- The price is currently consolidating above $9,300 and it is well above the 100 hourly simple moving average.
- There is a short-term contracting triangle forming with resistance near $9,385 on the hourly chart of the BTC/USD pair (data feed from Kraken).
- The pair is likely to continue higher if it clears the $9,385 and $9,400 resistance levels.
Bitcoin Price Signaling More Gains
Yesterday, we discussed the chances of bitcoin ending its deadlock of $9,000 against the US Dollar. BTC did break the range and started a strong increase above the $9,200 resistance level.
The bulls were able to clear the $9,300 resistance and the price settled well above the 100 hourly simple moving average. It even surpassed the $9,400 level and traded to a new weekly high at $9,437.
Bitcoin is currently consolidating gains below the $9,400 level. It traded below the 23.6% Fib retracement level of the recent rally from the $9,150 swing low to $9,437 high. There is a short-term contracting triangle forming with resistance near $9,385 on the hourly chart of the BTC/USD pair.
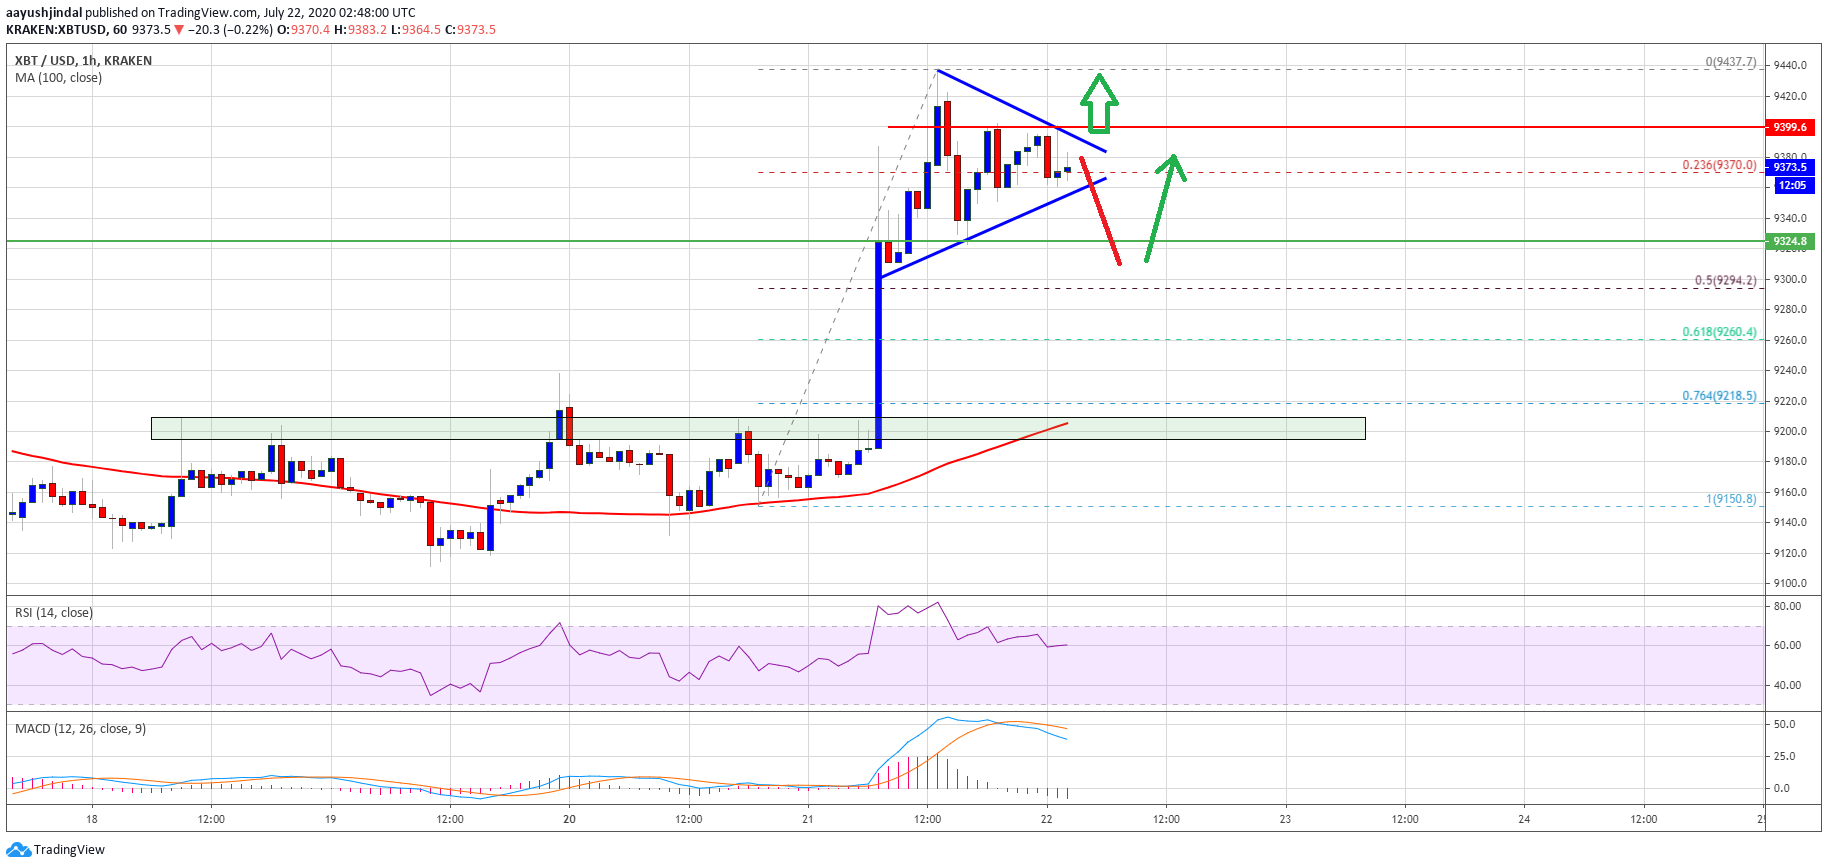
Bitcoin price breaks $9,400: Source: TradingView.com
If the pair breaks the triangle resistance and $9,400, it is likely to continue higher. A successful close above the $9,400 level will most likely open the doors for a push towards the $9,500 and $9,550 resistance levels in the coming sessions.
Any further gains could lead the price towards the $9,800 level. An intermediate resistance may perhaps be near the $9,650 level.
Dips Likely Supported in BTC
If bitcoin breaks the triangle support, it could correct below the $9,350 level. The next support is near the $9,300 level (a multi-touch zone). The 50% Fib retracement level of the recent rally from the $9,150 swing low to $9,437 high is also close to the $9,300 level.
Any further losses below $9,300 could push the price towards the main $9,200 support and the 100 hourly simple moving average. A close below the 100 hourly SMA might lead the price towards the $9,000 support.
Technical indicators:
Hourly MACD – The MACD is currently moving slowly in the bearish zone.
Hourly RSI (Relative Strength Index) – The RSI for BTC/USD is well above the 50 level.
Major Support Levels – $9,350, followed by $9,300.
Major Resistance Levels – $9,380, $9,400 and $9,550.


