

Bitcoin price is down $800 in just over 24 hours, and elsewhere in the finance space, there is pure carnage. Gold fell below $1900, and stocks are downward spiraling. And behind it all is the dollar. But why is the Dollar Currency Index (DXY) potentially responsible for the market-wide collapse and what exactly is driving it?
Bitcoin Price Collapses $800 In Early Week Selloff, Another Test of $10,000 Next?
Bitcoin price tapped over $11,000 one last time before a deadly drop began later Saturday night and into Sunday. The drop extended deeper into the weekday trading week, with a fall to under $10,400 starting Monday morning.
Related Reading | “Intense” Bitcoin Whale Exchange Flow Could Be Behind Weekend Crash
It wasn’t just Bitcoin, Ethereum, Ripple, and even top DeFi tokens tanked in the selloff. Blockchain data shows that miners were partly responsible for driving prices down, however, the drop is really due to the dollar.
The Dollar (DXY) Index Deals Devastating Blow To Crypto, Metals, and Stocks
Although Bitcoin has dragged down the rest of the crypto market, the leading cryptocurrency by market cap is just part of a market-wide collapse.
Alongside Bitcoin’s steep breakdown, the Dow Jones Industrial Average has bled over 800 points and gold is now trading back below $1900 an ounce.
Behind it all could be the dollar. The DXY Dollar Currency Index is a weighted basket of top forex currencies trading against the dollar.
Related Reading | Bitcoin, Metals, And Equities “Will Fly” If Dollar Downtend Deepens
Bitcoin and gold are directly opposed to the dollar, both trading against it as USD pairs and due to their finite supplies. Together, these assets ebb and flow at varying degrees.
When Bitcoin is strong, the dollar is often weak and vice-versa. And that’s exactly what has been behind the crypto asset’s recent climb to over $12,000 an inverse correlation with DXY shows.
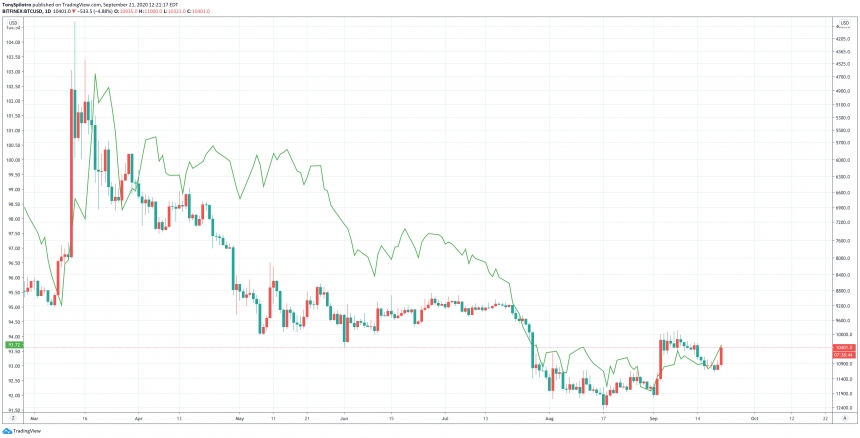
Inverse BTCUSD Versus DXY Dollar Currency Index Correlation | Source: TradingView
The March Black Thursday collapse was a panic-driven flight out of assets and into the safe haven of the dollar. Since then, however, markets have been soaring and the dollar has been in decline. Stimulus efforts to save the stock market and the economy have dampened the dollar’s legacy.
According to the DXY, the dollar recently found support and formed an inverse complex head and shoulders bottom. These reversal patterns are essentially an inverse head and shoulders with an extra head.
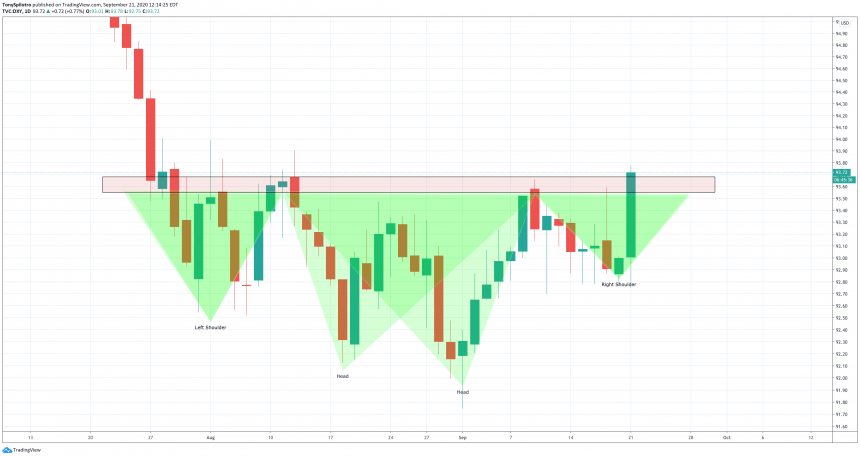
Inverse Complex Head And Shoulders DXY Dollar Currency Index Source: TradingView
Coincidentally, Bitcoin recently retested and confirmed a head and shoulders top pattern, adding to the inverse correlation theory. The cryptocurrency is currently headed back down after a throwback, while the DXY is only just now breaking through resistance.
This early break of resistance has already sent crypto, metals, and equities crashing, and the dollar’s recovery could only just be getting started.
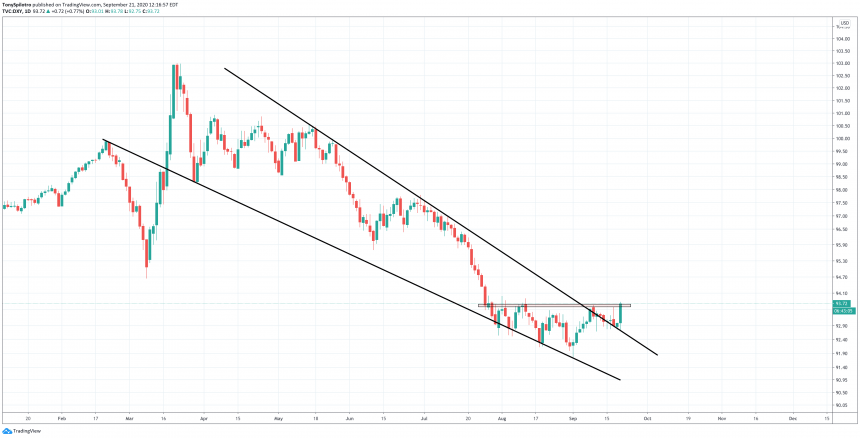
Falling Wedge Reversal Pattern DXY Dollar Currency Index Source: TradingView
Zooming out, the complex bottom formation is breaking out of a falling wedge reversal pattern on daily timeframes. After the initial breakout, DXY ground down diagonal support but has since made a strong rebound.
That rebound has absolutely crushed Bitcoin, and it may only just be getting started. If investors panic once again and money moves into the safety net of the dollar, markets could be in for another Black Thursday style collapse.


