
Bitcoin price suffered a powerful correction from the 2020 high of $12,400, taking the crypto asset back below $10,000 briefly. After a short-lived dead-cat bounce to $11,200, Bitcoin price is back once again at $10,500 and trying to hold.
Although the correction has been steep, the selloff closely resembles the last bull market’s most violent tops. And while sentiment has swiftly shifted bearish, if history repeats, buying even the scariest dips will be incredibly rewarding.
Crypto Bull Market Tops Match Current Price Action Despite Bearish Sentiment Shift
In a bull market, dips are for buying and can lead to enormous ROI. But at this stage of where Bitcoin is in its market cycle, combined with an economic environment full of uncertainty, it isn’t clear if the cryptocurrency is fully bullish, or remains in the grasps of a bear market.
Until a new all-time high is set, the market has more to thaw from the long crypto winter.
Breaking above $10,000 is one major step in the right direction for bulls, and holding seven straight retests on daily timeframes above it is the second. All that’s left is confirming the uptrend is intact by setting another new 2020 high.
But a recent severe selloff from the current high has turned sentiment bearish quickly, prompting investors to fear more downside ahead.
However, one keen-eyed crypto analyst has shared some compelling charts that suggest that the latest top, is just like past bull market tops, and the crypto asset is ready to fly higher.
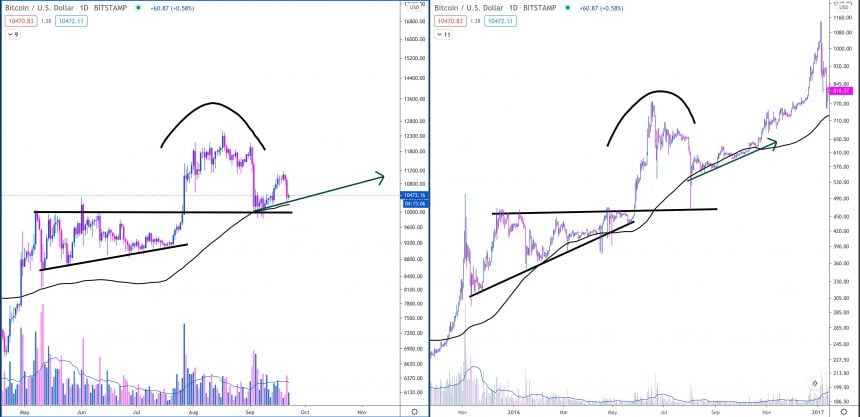
BTCUSD Daily Bull Market Top Historical Chart Comparison | Source: TradingView
In the above comparison, the most recent top in Bitcoin price action closely resembles the structure that took Bitcoin out from its bear market bottom the last time around and sent the cryptocurrency toward $20,000.
Related Reading | Bitcoin Weekly Momentum Flips Bearish For The First Time Since April
The below chart shows the same current top juxtaposed next to yet another bull market “top” in Bitcoin price action. After a fall, none of these “tops” ever proved to be actual peaks, and the crypto asset kept on climbing.
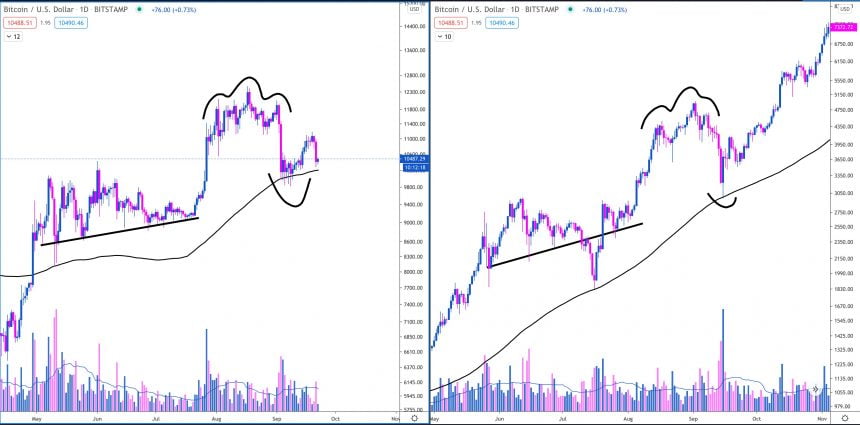
BTCUSD Daily Bull Market Top Historical Chart Comparison| Source: TradingView
Route 128: The Road To Successfully Buying The Dip In Bitcoin?
It’s also important to note, that within this crypto analyst’s charts, may also be another sign to look out for that the latest “top” more closely matches that of a bull market peak.
Within each smaller photo above, Bitcoin is holding strong at the 128-day moving average. Zooming out to view the bigger picture shows just how important this unusual support line has acted during previous bullish impulses.
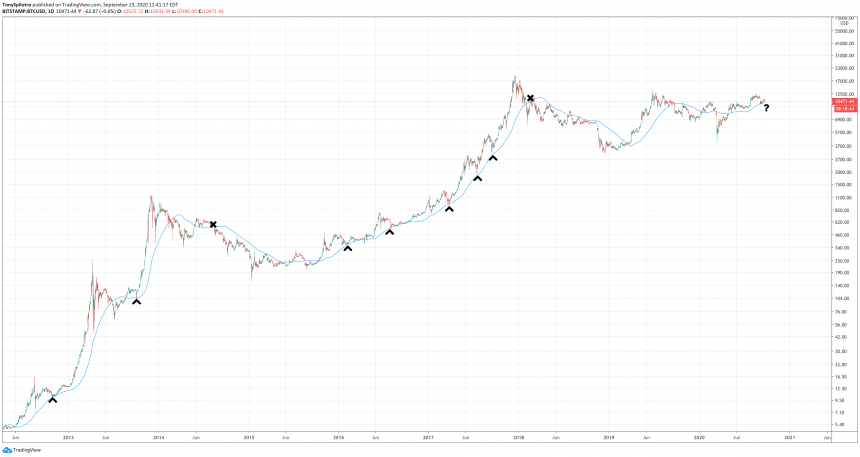
BTCUSD Daily Bull Market Support At 128-Day Moving Average | Source: TradingView
This moving average supported the cryptocurrency’s bullish continuation at each major pullback – pullbacks that closely resemble the one we just had.
Related Reading | Bitcoin Bouncing From Bull Market Support Points To 2021 As The Year Of Crypto
Bitcoin price is currently sitting right smack on the 128-day moving average, so we’ll soon find out if Bitcoin is indeed in a bull market, or if the crypto winter is about to get a lot colder.
Featured image from DepositPhotos, Charts from TradingView


