

Ethereum is up more than 8% and it broke the key $215 resistance zone against the US Dollar. ETH price is trading nicely above $220 and it could continue to rise above $230.
- Ethereum is showing a lot of positive signs and it rallied above $215 and $220.
- The price is likely to continue higher towards the $230 and $240 levels.
- There is a connecting bullish trend line forming with support near $212 on the hourly chart of ETH/USD (data feed via Kraken).
- The pair remains well supported on dips near $215 and $212 in the near term.
Ethereum Price Surging
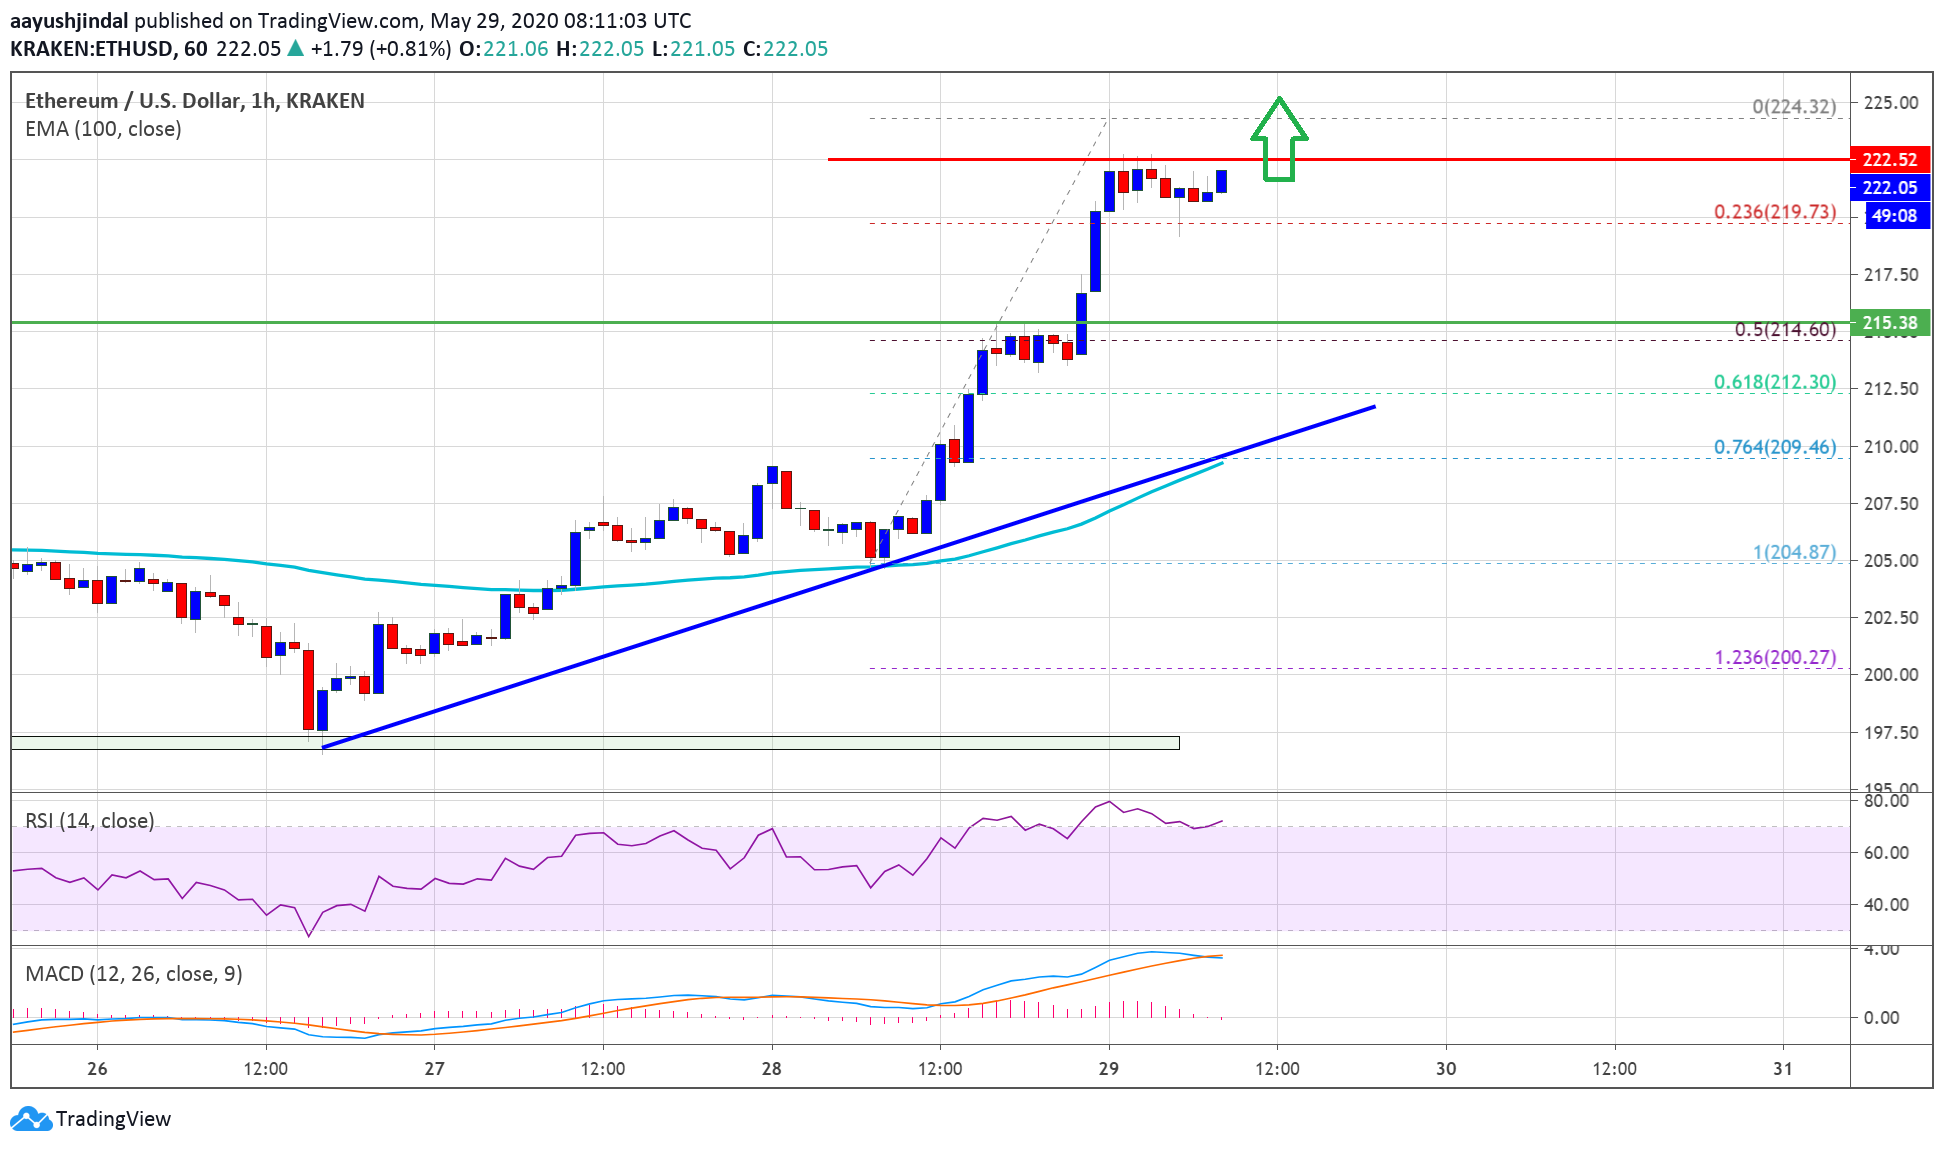
Ethereum price remained in a strong uptrend above the $205 level and it gained pace above the $210 barrier. ETH price managed to surpass the main $215 resistance zone to move into a bullish zone.
There was also a close above the $215 level and the 100 hourly simple moving average. Ether traded as high as $225 and it is currently consolidating gains. It tested the 23.6% Fib retracement level of the recent rally from the $204 swing low to $224 high.
The first major support on the downside is near the $215 zone. It is close to the 50% Fib retracement level of the recent rally from the $204 swing low to $224 high.
More importantly, there is a connecting bullish trend line forming with support near $212 on the hourly chart of ETH/USD. On the upside, the price is likely to continue higher above the $224 and $225 levels.
The first major resistance is near the $230 level. If there is a clear break above the $230 level, the price is likely to accelerate higher towards the $240 level. Any further gains could lead the price towards the $250 level.
Dips Supported in ETH
If Ethereum starts a downside correction, it is likely to remains supported near the $215 support zone (the recent breakout area). The trend line support at $212 is also a major support.
If there is a downside break below the $212 support zone, the price is likely to test the main $210 support and the 100 hourly simple moving average, which is also a key breakdown area.
Technical Indicators
Hourly MACD – The MACD for ETH/USD is gaining momentum in the bullish zone.
Hourly RSI – The RSI for ETH/USD is now well above the 60 level, with a positive angle.
Major Support Level – $215
Major Resistance Level – $225
Take advantage of the trading opportunities with Plus500
Risk disclaimer: 76.4% of retail CFD accounts lose money.


