
Analysis
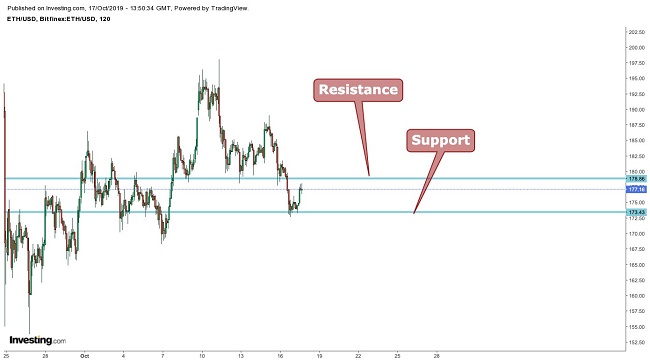
When looking at the chart below, we can see that Ethereum (ETH)trade is currently trading at $177.8. The price has broken the support of $178, turning it into resistance with new support at $173.43.
The price seems to be stuck between the channels, like Bitcoin, with the resistance as the upper limit and support as the lower limit. The price is approaching the resistance so it is suggested not to take long positions at this price, until the resistance is broken.
Dow Theory
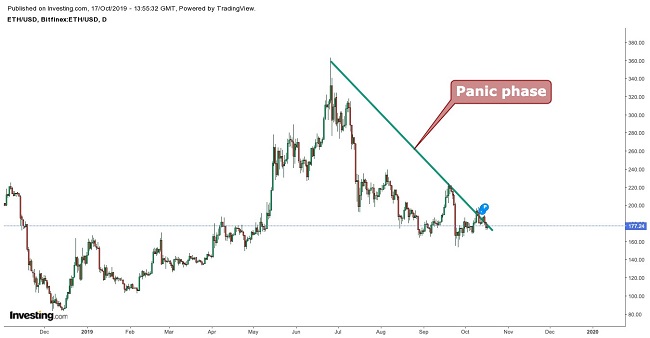
According to Dow Theory, the ETH price is in the panic phase. In this phase, distressed selling is seen from those who believe that the worst is yet to come or are forced to liquidate before they another suspected fall. This phase is followed by the accumulation phase where informed investors take long positions.
Bollinger Bands
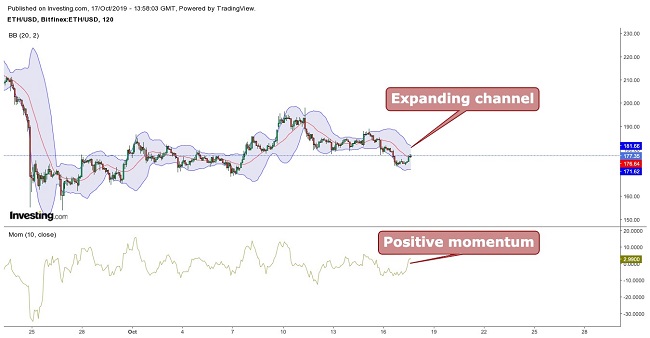
Ethereum’s price is moving between the channels with the lower channel limit acting as support and the middle average line acting as resistance. It can be seen that the channel is expanding with a positive momentum.

This indicates increased volatility with a positive sentiment, so the second-largest cryptocurrency’s price might go up, but it is still suggested to wait until the price closes a trading day above the resistance level.
Moving Average
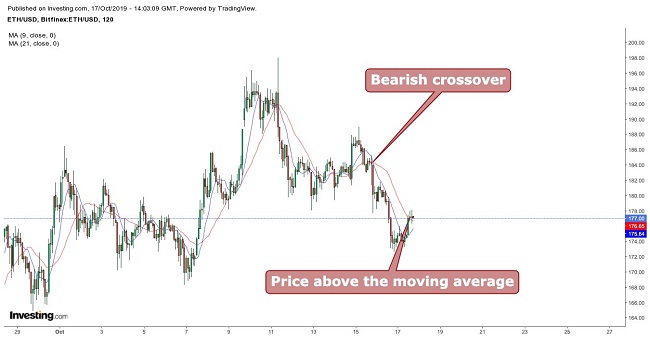
When taking 9 period moving averages (blue) with 21 period moving averages (red), a bearish crossover is seen, but the price is moving above the 9 and 21 period moving averages. This indicates an uptrend but we see formation of a doji, which alternatively indicates indecision. So it is suggested to wait until the other factors turn more positive.
Conclusion
When looking at the chart, we see that Ethereum (ETH)trade is currently trading at $177.8. The resistance is at $178 with support at $173.43. The cryptocurrency’s price is expected to trade between the channels so swing trading can be done.
Taking long positions is not suggested until the price closes above the resistance or at least touches the support. A close above $179 can take the price up to $190 and a close below $170 can drag the price down to $160. Overall, the trend looks bullish.
Pivot Points
| Name | S3 | S2 | S1 | Pivot Points |
R1 | R2 | R3 |
| Classic | 136.63 | 152.47 | 166.32 | 182.16 | 196.01 | 211.85 | 225.70 |
| Fibonacci | 152.47 | 163.81 | 170.82 | 182.16 | 193.50 | 200.51 | 211.85 |
| Camarilla | 172.00 | 174.72 | 177.44 | 182.16 | 182.88 | 185.60 | 188.32 |
| Woodie’s | 135.63 | 151.97 | 165.32 | 181.66 | 195.01 | 211.35 | 224.70 |
Technical Indicators
| Name | Value | Action |
| RSI(14) | 44.285 | Sell |
| STOCH(9,6) | 37.411 | Sell |
| STOCHRSI(14) | 28.867 | Sell |
| MACD(12,26) | -1.320 | Sell |
| ADX(14) | 16.878 | Neutral |
| Williams %R |
-79.380 | Sell |
| CCI(14) | -82.8088 | Sell |
| ATR(14) | 33.2129 | Less Volatility |
| Highs/Lows(14) | -1.0769 | Sell |
| Ultimate Oscillator |
49.678 | Neutral |
| ROC | -33.812 | Sell |
| Bull/Bear Power(13) |
-28.8880 | Sell |