

Analysis
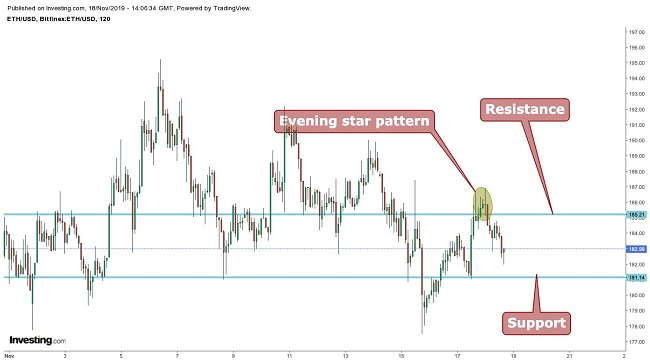
When looking at the chart below we can see that Ethereum (ETH)trade is currently trading at $184. It can also be observed that the second-largest cryptocurrency’s price is trading within the channel with the upper limit at around $185 acting as resistance and the lower limit of the channel at around $181 is acting as support.
This is also confirmed by a formation of an evening star pattern, which is a bearish reversal pattern.
Dow Theory
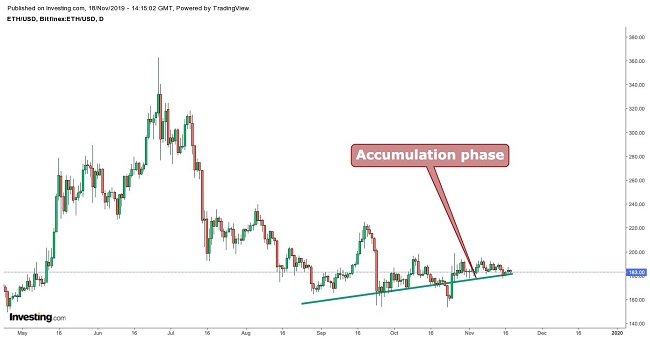
The virtual currency is currently appearing in the the accumulation phase. This is the phase when the informed and experienced investors are actively buying more of the virtual coin against the general opinion of the crypto market.
During this phase, the ETH price does not change much because these investors are in the minority, demanding supply that is abundantly available.
Bollinger Bands
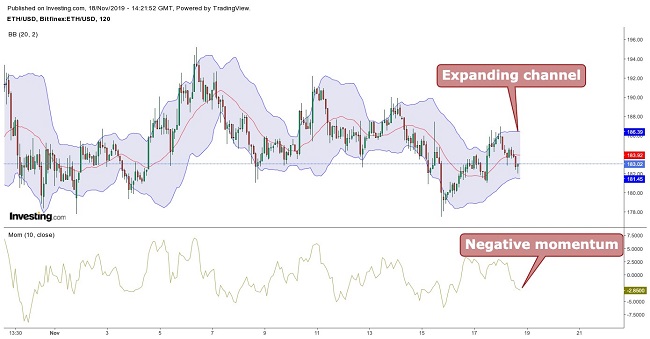
Ethereum’s price is moving between the channels with the lower limit acting as support and the upper limit acting as resistance. It is seen that the channel is expanding with a negative momentum, which indicates increased volatility but, again, a negative momentum.
Therefore some correction is expected, and taking long positions is not suggested at this current price.
Moving Average
When taking 9 period moving averages (blue) with 21 period moving averages (red), a bearish crossover is seen, whilst the ETH price is trading below the 9 and 21 period moving averages. This indicates that a further correction in the price is expected.

Conclusion
Ethereum (ETH)trade is currently trading at $184, while the resistance is at $185 and support at $181. Looking at all the various indicators it is suggested not to take long positions at this price as further correction is likely.
Long positions can be taken around for swing trading, as there is no indication for a price breakout. A day closing below $181 can drag the price all the way down to the $176 levels and a day closing above $186 can take the price up to the $193 levels. The overall trend looks neutral so only swing trading is suggested.
Pivot Points
| Name | S3 | S2 | S1 | Pivot Points | R1 | R2 | R3 |
| Classic | 161.53 | 169.50 | 176.23 | 184.20 | 190.93 | 198.90 | 205.63 |
| Fibonacci | 169.50 | 175.12 | 178.58 | 184.20 | 189.82 | 193.28 | 198.90 |
| Camarilla | 178.93 | 180.28 | 181.62 | 184.20 | 184.32 | 185.67 | 187.01 |
| Woodie’s | 160.93 | 169.20 | 175.63 | 183.90 | 190.33 | 198.60 | 205.03 |
Technical Indicators
| Name | Value | Action |
| RSI(14) | 45.992 | Neutral |
| STOCH(9,6) | 40.094 | Sell |
| STOCHRSI(14) | 47.049 | Neutral |
| MACD(12,26) | 0.610 | Buy |
| ADX(14) | 18.228 | Neutral |
| Williams %R | -58.531 | Sell |
| CCI(14) | -7.3549 | Neutral |
| ATR(14) | 25.4398 | Less Volatility |
| Highs/Lows(14) | 0.0000 | Neutral |
| Ultimate Oscillator | 44.513 | Sell |
| ROC | -1.528 | Sell |
| Bull/Bear Power(13) | -15.4700 | Sell |


