

Ethereum is trading nicely above the $175 support area against the US Dollar. ETH price is showing a lot of positive signs and it could continue to rise towards $188 and $195.
- Ethereum corrected lower and tested the main $175 support area.
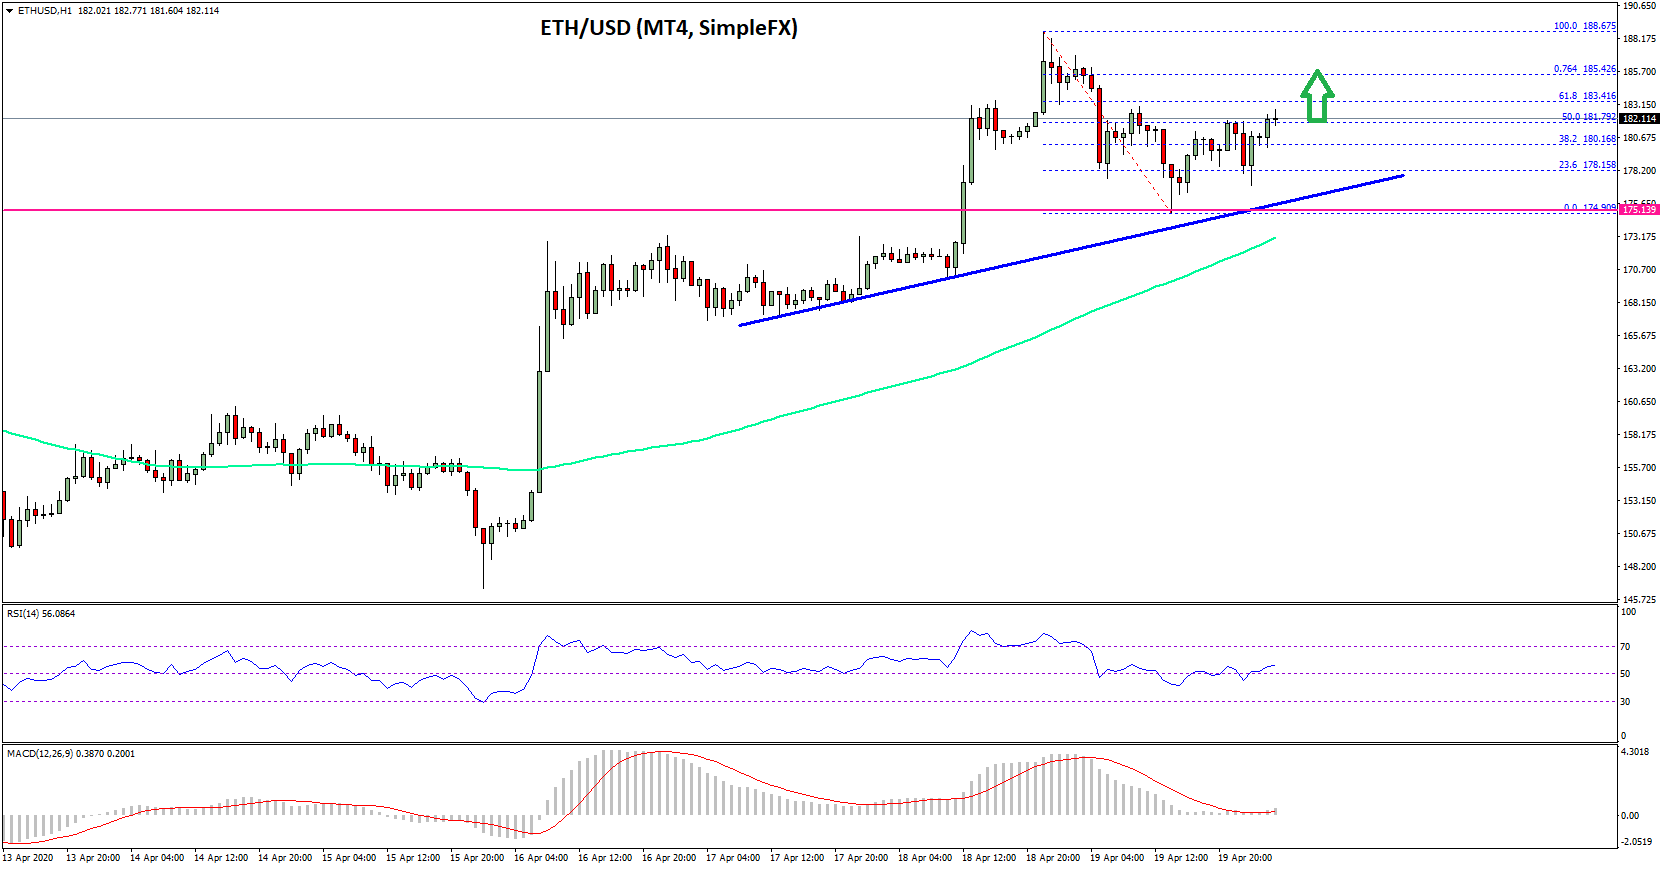
- The price is currently rising and trading above the $180 pivot level.
- There is a major bullish trend line forming with support near $178 on the hourly chart of ETH/USD (data feed via SimpleFX).
- The pair is likely to accelerate higher once it clears the $185 and $188 resistance levels.
Ethereum Price Could Resume Uptrend
In the past few days, we saw a sharp rise in Ethereum above the $165 and $175 resistance levels against the US Dollar. ETH price even surpassed the $180 resistance and settled well above the 100 hourly simple moving average.
It traded to a new monthly high near $188 before starting a downside correction (similar to bitcoin). There was a correction below the $180 level, but the bulls were able to defend the key $175 support area.
It seems like there is a strong support base forming above the $175 level and the 100 hourly simple moving average. There is also a major bullish trend line forming with support near $178 on the hourly chart of ETH/USD.
The recent low was formed near $175 and Ethereum is currently rising. There was a break above the $180 level, plus the 50% Fib retracement level of the recent correction wave from the $188 high to $175 swing low.
On the upside, an initial hurdle for the bulls is near the $185 level. It is close to the 76.4% Fib retracement level of the recent correction wave from the $188 high to $175 swing low. A successful break above the $185 resistance level could open the doors for more gains above the $188 high.
The next resistance is near the $195 level, above which the bulls are likely to aim a test of the $200 handle in the near term.
Downside Correction?
On the downside, the $175 support area and the trend line hold a lot of importance. The next key support is near the $173 level or the 100 hourly simple moving average.
If there is a bearish break below the $175 and $173 support levels, there is a risk of a larger downside correction towards the $165 level.
Technical Indicators
Hourly MACD – The MACD for ETH/USD is slowly moving in the bullish zone.
Hourly RSI – The RSI for ETH/USD is currently just above the 50 level.
Major Support Level – $175
Major Resistance Level – $185
Image from unsplash


