

Ethereum is facing risks of undergoing a massive plunge as it partially confirms a bearish flag pattern.
The technical setup appears after an asset forms a consolidation channel upward following a strong bearish move. The downward movement is called flagpole, while the consolidation is referred to as the “flag” itself. Ethereum is forming the same pattern, as shown in the chart below.
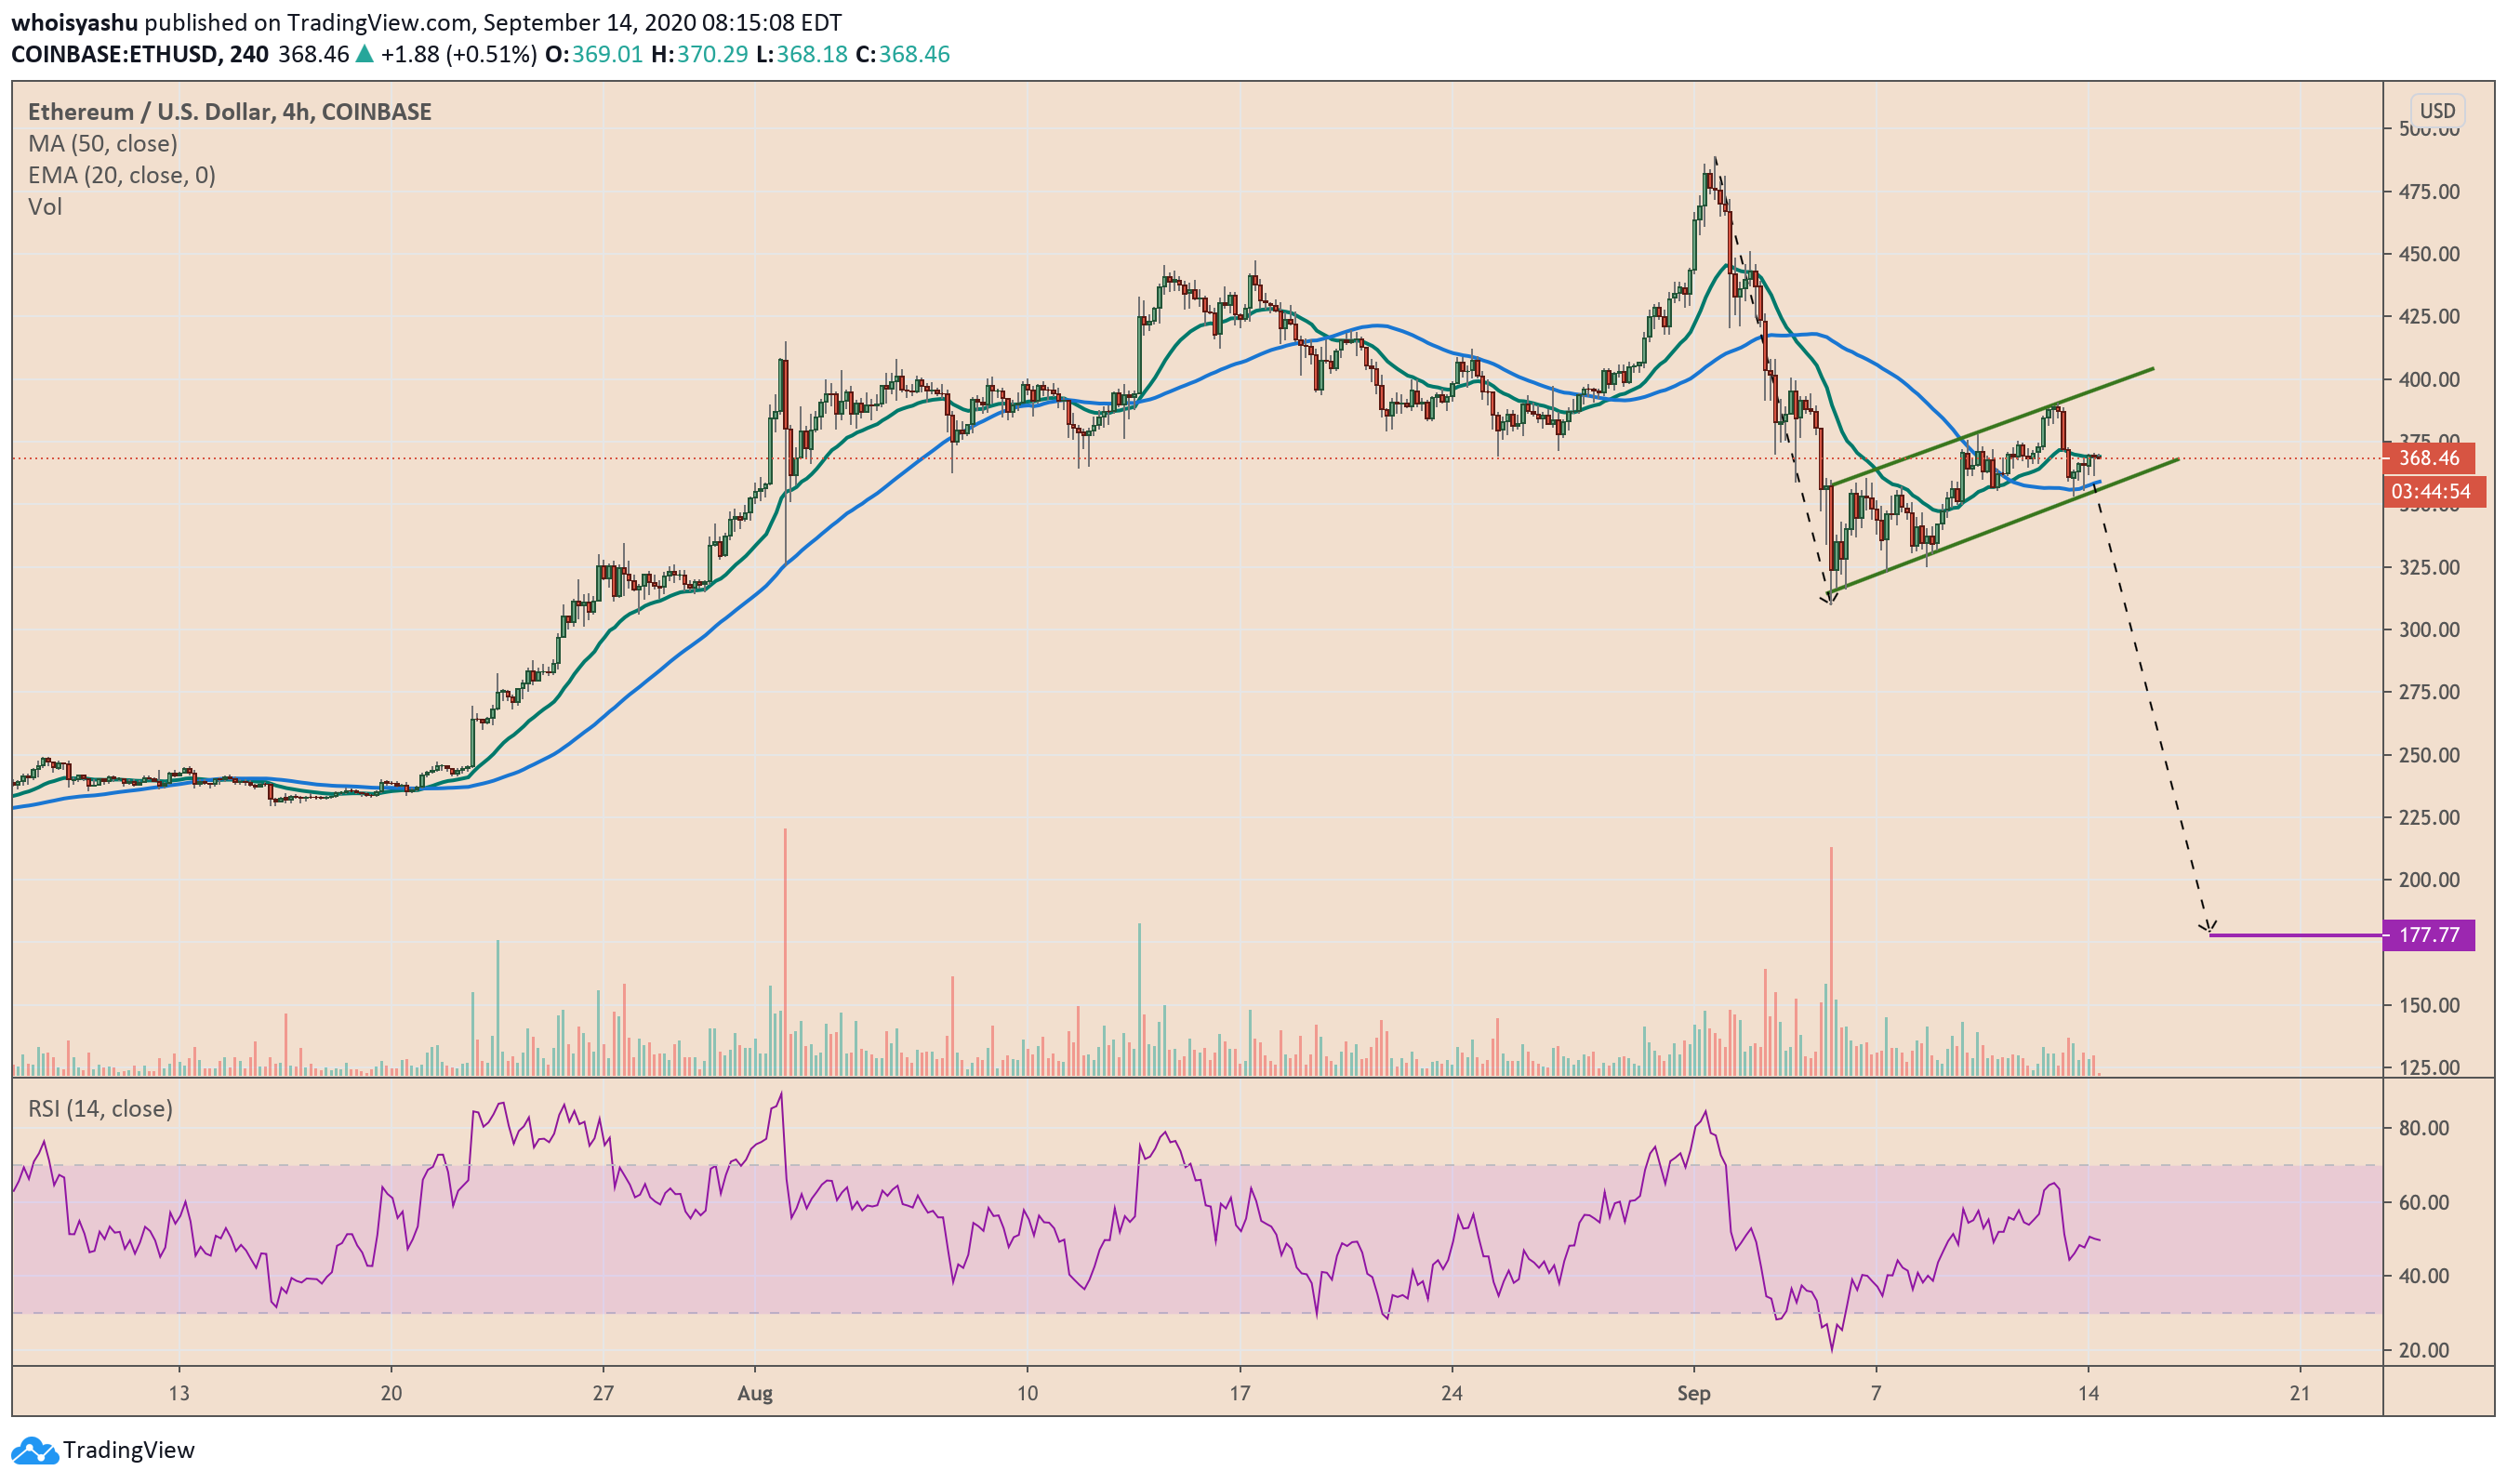
ETH/USD is consolidating in an upward channel. Source: TradingView.com
The second-largest cryptocurrency is forming a flag pattern followed by a large slope downwards – a flagpole whose maximum height is near $178. Thereby, if ETH/USD breaks below the upward channel support, then it is at the risk of declining by as much as $178 from the point of breakdown.
That is, at least, according to the technical description of a Bearish Flag pattern. If ETH/USD breaks to the downside today, then its primary downside target sits at $177. Nevertheless, breaking down from a higher level will naturally lift the Flag target as well.
A Bearish Flag, meanwhile, is never 100 percent accurate. For instance, if the upward channel retracement extends beyond 50 percent, then there is a less likelihood of bearish continuation and more of an extended uptrend. Ideally, the bounce back to confirm a Bearish Flag should be no more than 38 percent.
Fib Retracement
The graph below shows an accurate description of the Ethereum’s retracement following its move from $488-high to $323-low.
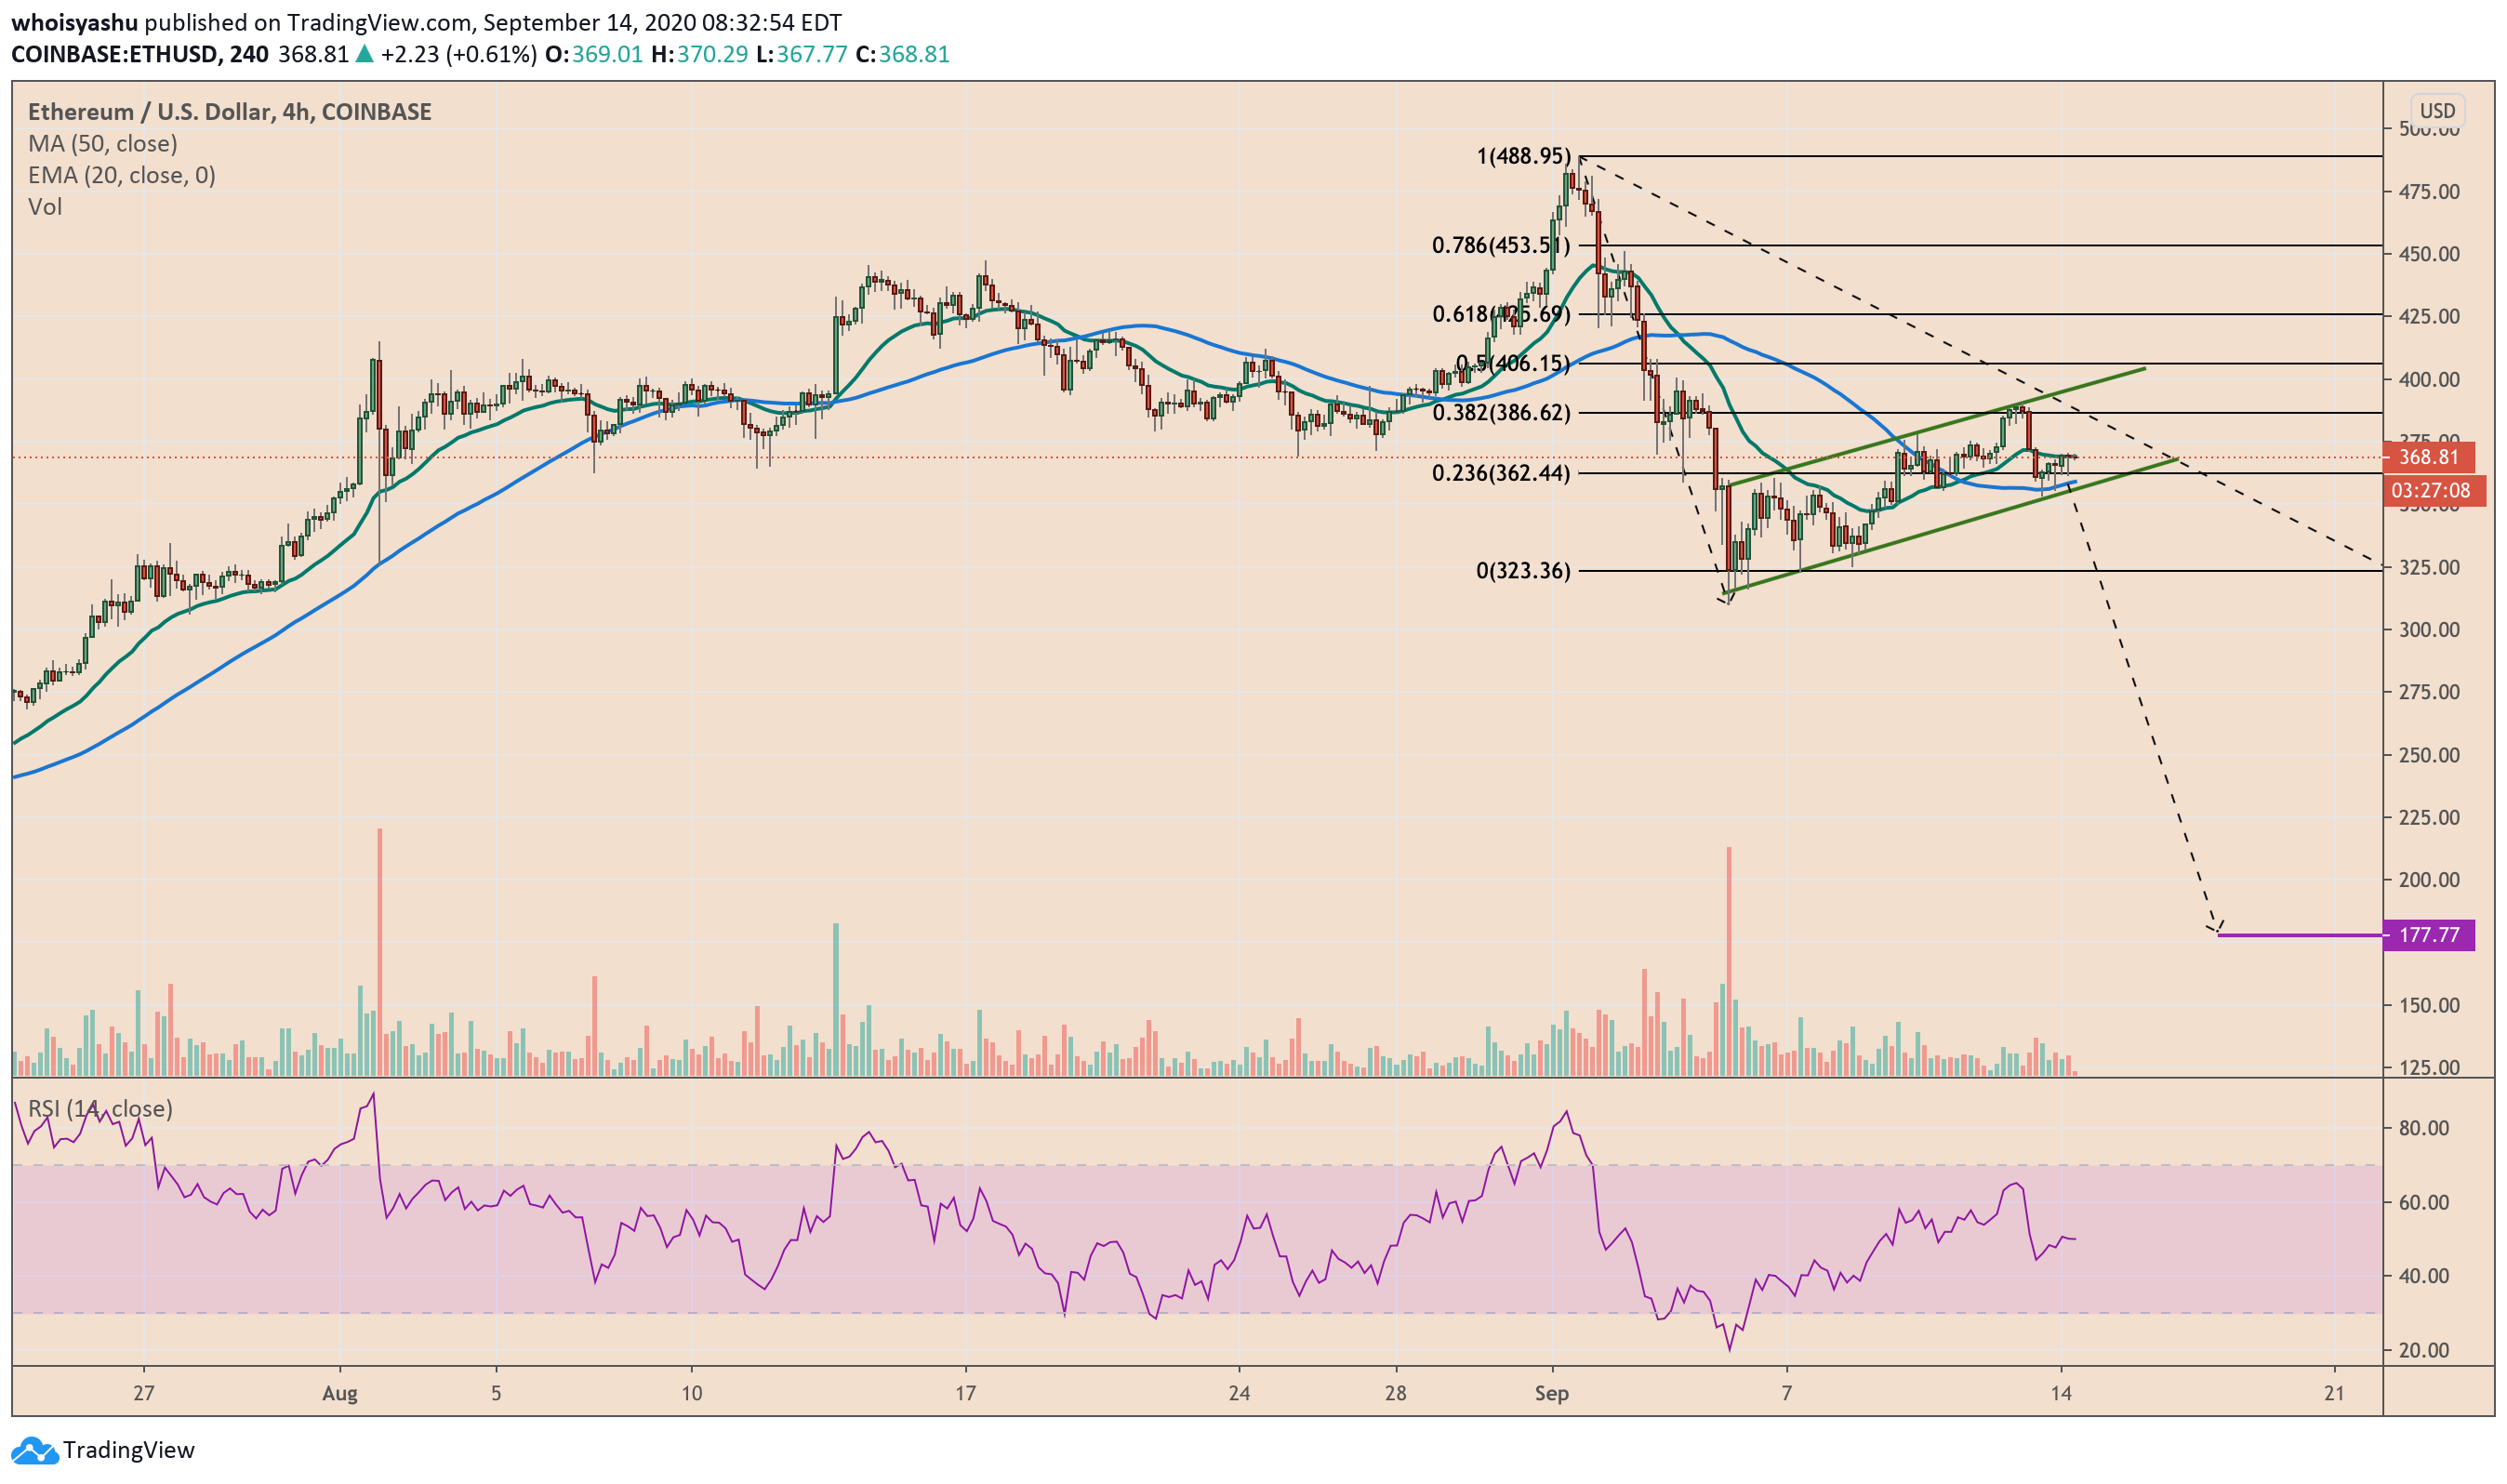
Ethereum price targets in a Bear Flag pattern. Source: TradingView.com
The price has reversed once from the 38.2% level of the graph at circa $386. Meanwhile, it has spotted good support near the 23.6% level at near $362. ETH/USD is currently attempting to retest $386 as its interim long target while eyeing a continuation towards the 50% level at circa $406.
Such a move may end up invalidating the Bearish Flag altogether, putting ETH/USD en route to a breakout move towards $425, $453, and so on.
Supportive Ethereum Fundamentals
A looming Bearish Flag crisis also eyes negation with supportive on-chain metrics. It is the data on the Ethereum blockchain that observers study to guess investors’ sentiment for the cryptocurrency.
Konstantin Anissimov, Executive Director at CEX.IO, mentioned one of such metrics in his weekly note to clients. The analyst noted that Ethereum’s 36 percent price correction brought ample opportunities for whales to buy the token for cheap.
“Data reveals that roughly 68 new addresses holding between 1,000 to 10,000 ETH joined the network during the market-wide correction,” he noted.
Meanwhile, a pseudonymous trader expected Ethereum to drop further if it closes the week below $360. The comment came on Sunday whereby ETH/USD plunged to as low as $355 but closed near $365. That showed a short-term bias conflict in the market.
If the pair plunges back below $360, then it would continue to play out the Bearish Flag narrative.


