

- Ethereum price is currently struggling to climb above $178 and $180 against the US Dollar.
- Bitcoin price is declining and it seems like it failed to stay above $8,220 and $8,200.
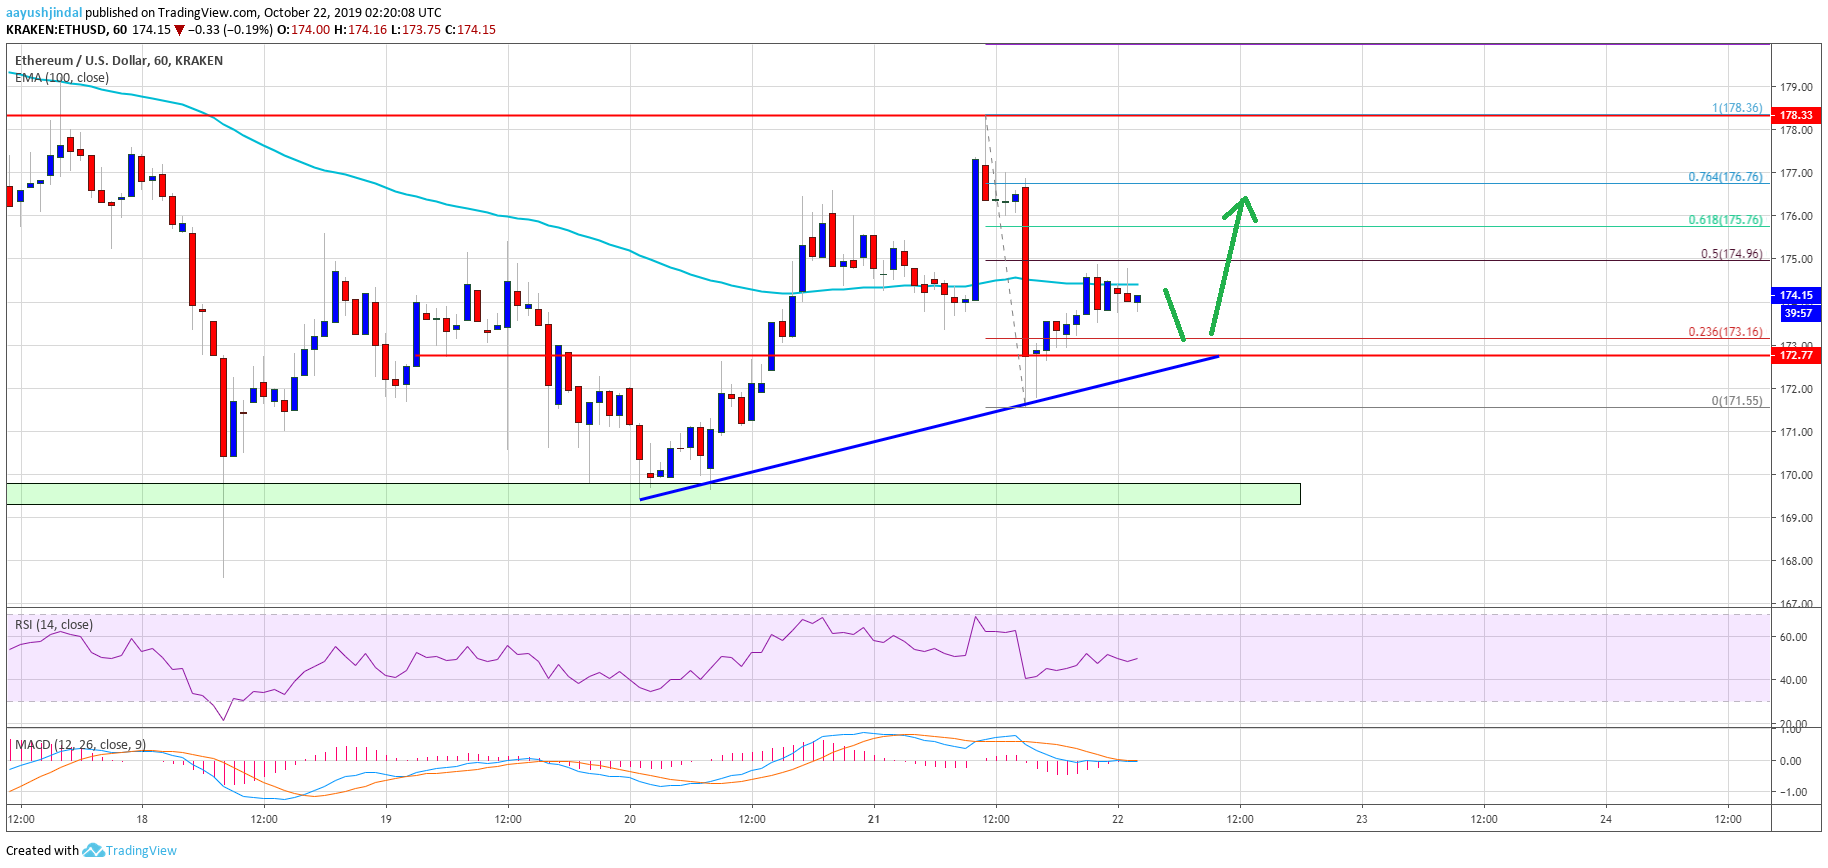
- There is a short term bullish trend line forming with support near $172 on the hourly chart of ETH/USD (data feed via Kraken).
- The pair could recover to $180 as long as there is no close below the $170 support area.
Ethereum price is showing a few bearish signs versus the US Dollar, while bitcoin is declining. ETH price could bounce back as long as the $170 support holds.
Ethereum Price Analysis
Yesterday, we saw a decent recovery in Ethereum above the $175 resistance against the US Dollar. More importantly, bitcoin price gained traction and climbed above the $8,200 resistance area.
However, BTC failed to stay above the $8,220 and $8,000 level. It is currently declining, dragging Ethereum and ripple lower.
Recently, ETH price spiked above the $178 level, but it failed to continue higher. As a result, there was a fresh decline and the price declined below $175. A low was formed near $171.55 and the price is currently correcting higher.
It recovered above the 23.6% Fib retracement level of the recent decline from the $178 high to $171 swing low. At the moment, it is consolidating near the $175 resistance and the 100 hourly simple moving average. Besides, it seems like the 50% Fib retracement level of the recent decline from the $178 high to $171 swing low is acting as a resistance.
If there is an upside break above the $175 resistance, the price could recover towards the $178 resistance area. Having said that, a clear break above the $178 and $180 resistance levels is must for a steady rise in the near term.
On the downside, there are many supports near the $172 and $170 levels. Additionally, there is a short term bullish trend line forming with support near $172 on the hourly chart of ETH/USD. If there is a downside break below the trend line, the price could even decline below the $170 support.
Looking at the chart, Ethereum price is clearly trading in a broad range between $170 and $180. A clear break and close on either side might set the pace for the next move. As long as there is no daily close below $170, there are chances of an increase above the $178 and $180 resistance levels in the near term.
ETH Technical Indicators
Hourly MACD – The MACD for ETH/USD is slowly moving into the bullish zone.
Hourly RSI – The RSI for ETH/USD is currently above 50 and is moving higher.
Major Support Level – $170
Major Resistance Level – $178


