

- Ethereum is currently correcting higher from the $132 low against the US Dollar.
- Bitcoin price is also recovering and it is now trading above the $7,000 level.
- Yesterday’s major bearish trend line was breached with resistance near $145 on the hourly chart of ETH/USD (data feed via Kraken).
- The price is likely to correct further higher, but the $155 resistance is likely to act as a hurdle.
Ethereum price is showing signs of an upside correction versus the US Dollar, similar to bitcoin. ETH price could only move into a positive zone once it breaks the $155 resistance.
Ethereum Price Analysis
Yesterday, there was a sharp decline in Ethereum below the $155 and $150 support levels against the US Dollar. Moreover, ETH price settled below the $155 pivot level and the 100 hourly simple moving average.
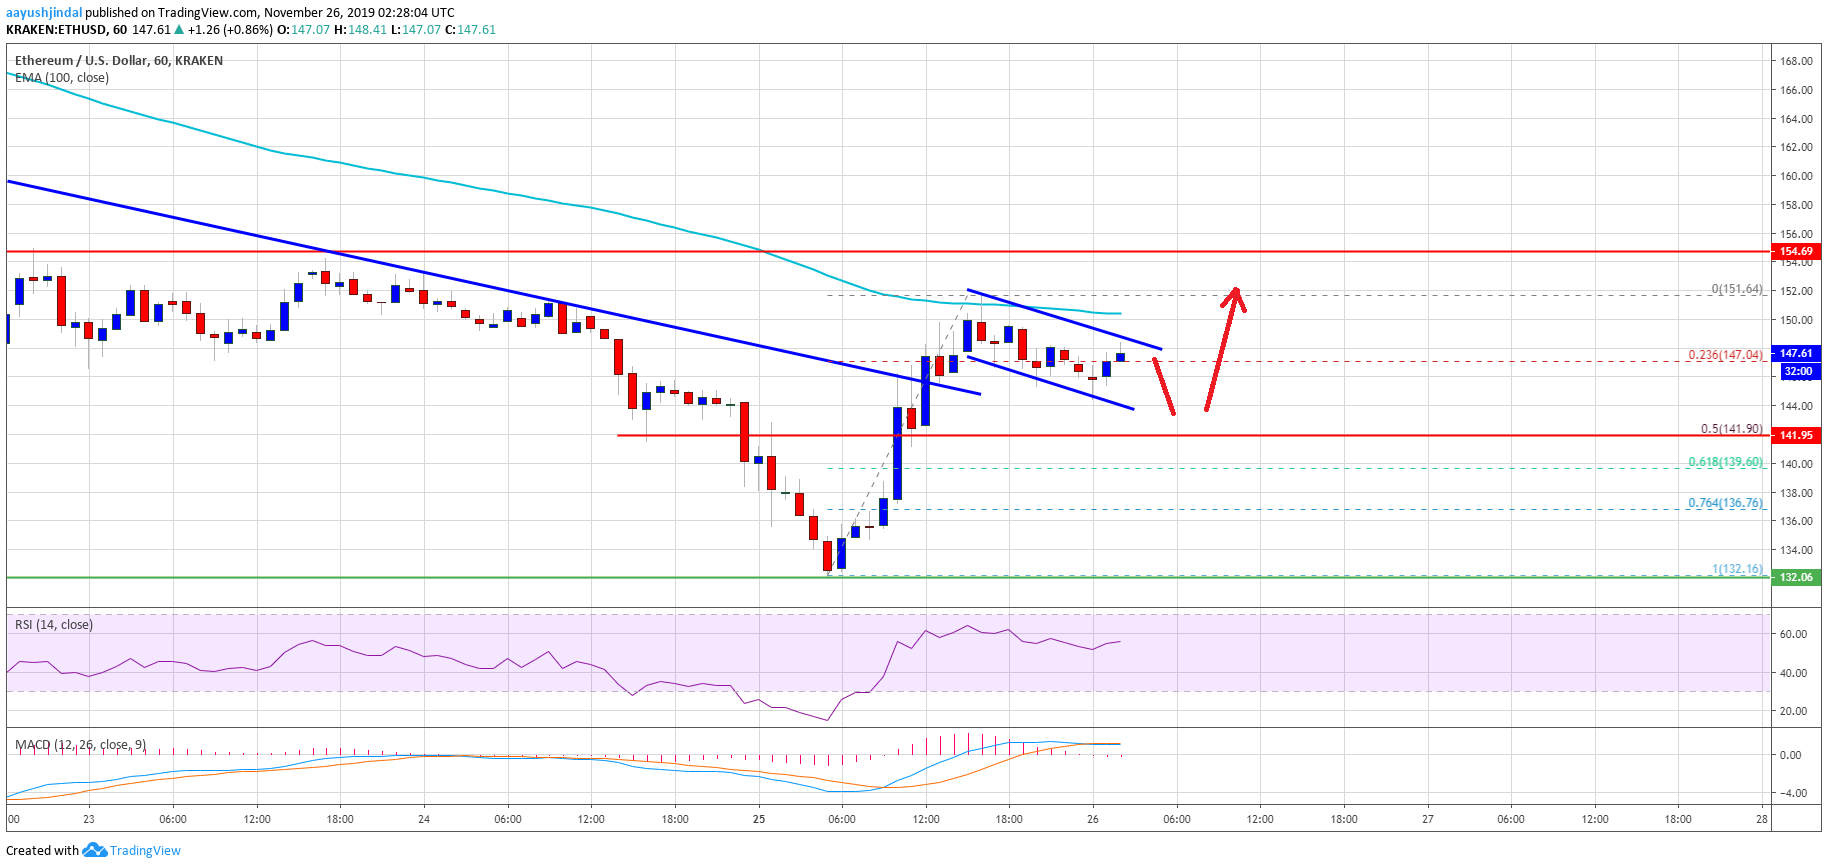
Finally, the price traded below the $140 support area and a new multi-month low was formed near the $132 level. Recently, the price started an upside correction above the $138 and $140 resistance levels.
Besides, yesterday’s major bearish trend line was breached with resistance near $145 on the hourly chart of ETH/USD. The price even spiked above the $150 level, but it struggled to climb above the 100 hourly simple moving average.
It is currently trimming gains below $150. Additionally, there was a break below the 23.6% Fib retracement level of the recent upside correction from the $132 low to $152 high.
It seems like there is a bullish flag pattern forming with resistance near the $150 level. If there is an upside break above the $150 and $152 levels, the price could test the main downtrend resistance near the $155 level.
A successful daily close above the $155 resistance is needed for a strong recovery. The next key resistances are near $168 and $170. On the downside, an initial support is near the $144 level.
The first key support is near the $142 area. It represents the 50% Fib retracement level of the recent upside correction from the $132 low to $152 high. Therefore, a downside break below the $142 support area could push the price lower towards the $135 and $132 levels.
Looking at the chart, Ethereum price is showing a few positive signs, but the $155 resistance is a major hurdle along with the 100 hourly SMA. Only a close above $155 could set the pace for a fresh increase in the near term.
ETH Technical Indicators
Hourly MACD – The MACD for ETH/USD is currently losing momentum in the bullish zone.
Hourly RSI – The RSI for ETH/USD is currently above the 50 level, with a few positive signs.
Major Support Level – $142
Major Resistance Level – $155

 See Wild Session With $9M Liquidations")
