
- Ethereum is down more than 8% and it tested the final $155 bearish target against the US Dollar.
- Bitcoin price is also down around 6% and it traded close to the $7,400 bearish target (as discussed yesterday).
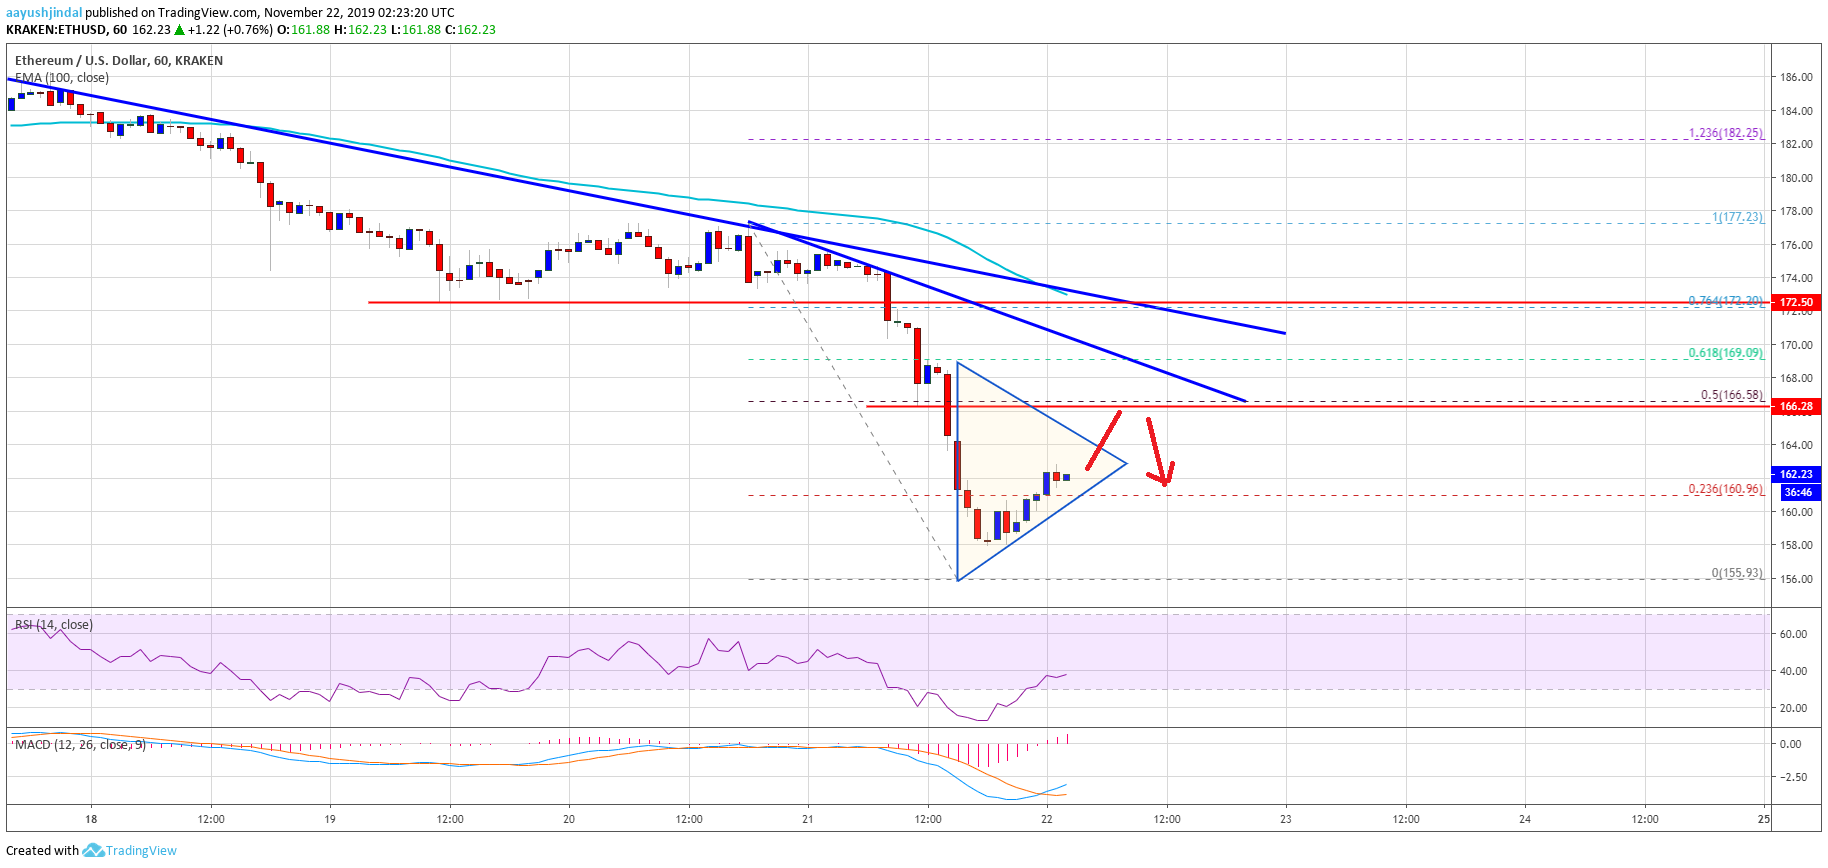
- There is a short term contracting triangle forming with resistance near $165 on the hourly chart of ETH/USD (data feed via Kraken).
- The price might correct higher towards $165 or even $168 before declining again.
Ethereum price is declining heavily versus the US Dollar, and bitcoin broke $7,650. ETH is currently correcting higher after tagging the key $154-$155 support area.
Ethereum Price Analysis
In the weekly forecast, we discussed the chances of a breakdown in Ethereum if it trades below the $180 support against the US Dollar. ETH price did settle below the $180 support and 100 hourly simple moving average, resulting in a sharp decline.
The price broke many supports near $172 and $166. Moreover, it is down close to 8% today and it recently tested the $154-$155 support area (the final possible target for the bears this month).
A new monthly low was formed near $156 and the price is currently correcting higher. It traded above the $160 level. Besides, there was a break above the 23.6% Fib retracement level of the recent decline from the $177 high to $156 low.
At the outset, there is a short term contracting triangle forming with resistance near $165 on the hourly chart of ETH/USD. Above the triangle resistance, the $166 level could also act as a strong hurdle for the bulls.
Additionally, the 50% Fib retracement level of the recent decline from the $177 high to $156 low is near the $166 level. Therefore, Ethereum price is likely to face a strong selling interest near the $165 and $166 levels.
Once the current corrective wave is complete, the price might decline below $160. However, there are chances of ranging moves above the $155 support area for some time before the next major move.
If there is a downside break below the $154-$155 support area, the chances of a decent recovery in the near term will most likely fade. The next key support is seen near the $142 level.
Looking at the chart, Ethereum price is clearly struggling below the $166 and $172 level. The current wave is likely to complete near $166 or $172 before the bears take back control. Only a close above $172 could decrease the current bearish pressure.
ETH Technical Indicators
Hourly MACD – The MACD for ETH/USD is slowly moving back into the bullish zone.
Hourly RSI – The RSI for ETH/USD is currently correcting higher, but it is well below the 40 level.
Major Support Level – $154
Major Resistance Level – $166


