

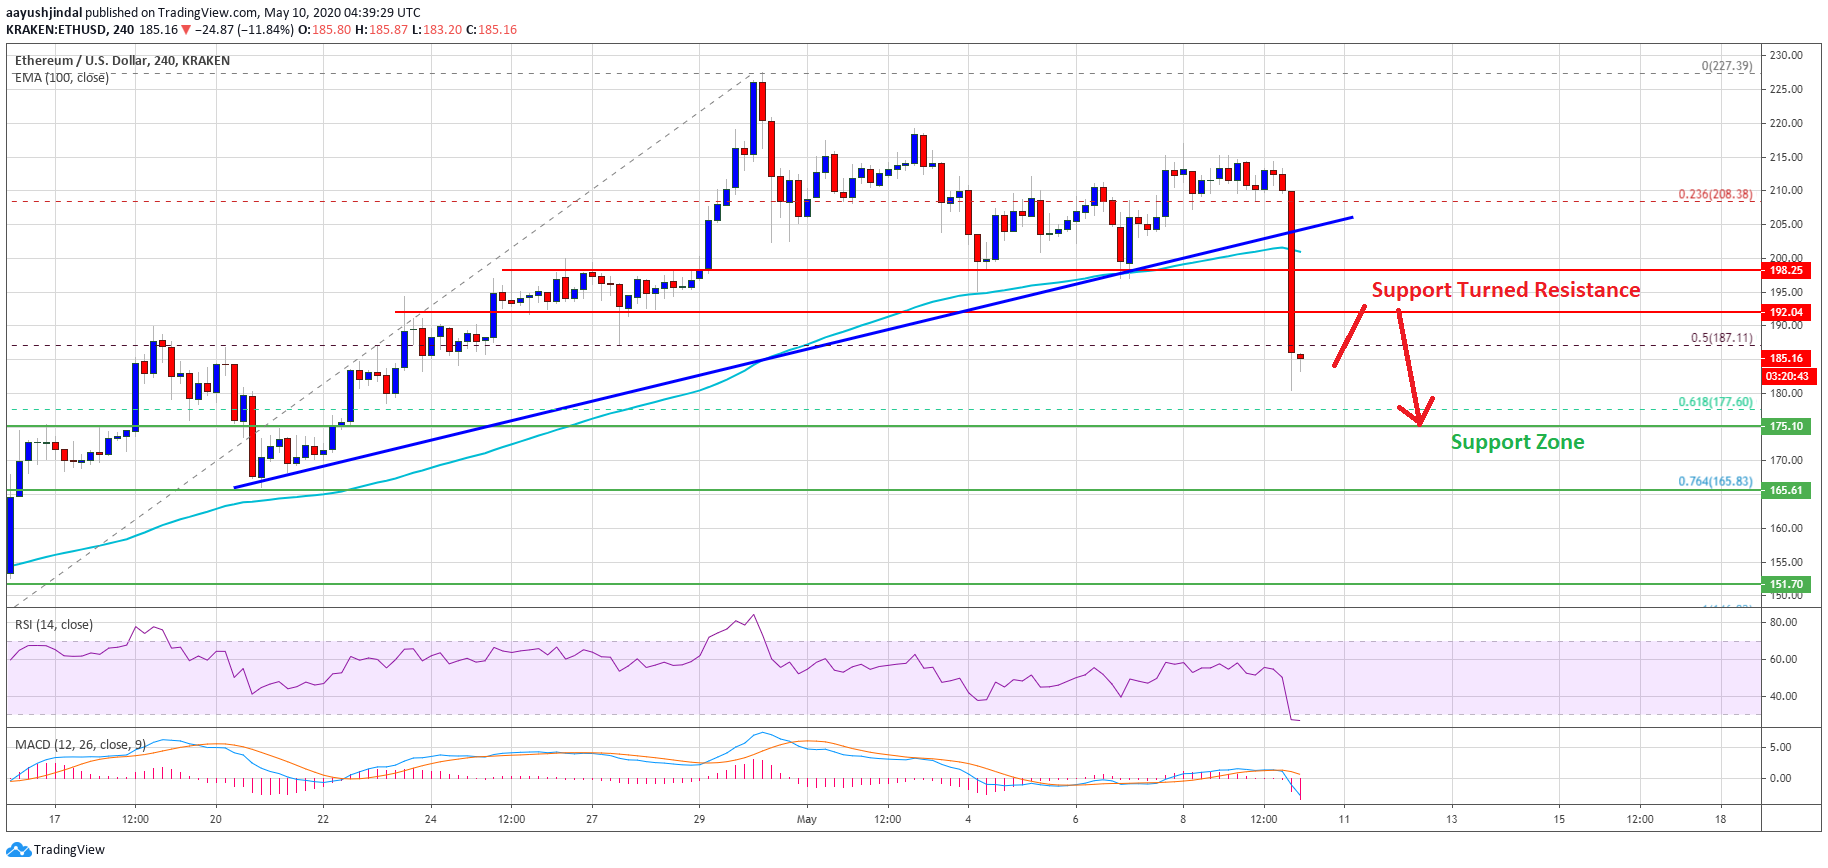
Ethereum is down more than 10% and it broke the key $200 support against the US Dollar. Bitcoin’s decline is increasing pressure on ETH and it could decline further to $175.
- ETH price is gaining bearish momentum and it broke the key $200 support zone against the US Dollar.
- It is now trading below $192 and the 100 simple moving average (4-hours).
- There was a break below a key bullish trend line with support near $205 on the 4-hours chart of ETH/USD (data feed via Kraken).
- The pair is likely to continue lower towards the next major support at $175 or $165.
Ethereum Price Turns Red
This past week, Ethereum made a couple of attempts to gain bullish momentum above the $210 resistance area against the US Dollar, but it failed. ETH price formed a local top near the $215 level and started a strong decline.
The recent decline in bitcoin below the $9,000 support sparked heavy bearish moves in Ether. It broke the main $202 and $200 support levels to move into a bearish zone.
More importantly, there was a break below a key bullish trend line with support near $205 on the 4-hours chart of ETH/USD. The pair even settled below the $192 support and the 100 simple moving average (4-hours).
It is now trading below the 50% Fib retracement level of the upward move from the $146 swing low to $227 swing high. The current price action suggests that Ethereum might continue to move down below the $180 level.
The first key support is seen near the $175 level. It represents the previous breakout zone and coincides with the 61.8% Fib retracement level of the upward move from the $146 swing low to $227 swing high.
Any further losses may perhaps open the doors for a larger decline towards the $165 and $162 support levels in the near term.
Upsides Capped
If Ethereum starts an upside correction, an immediate resistance is near the $192 level. The first major resistance for buyers is seen near the $200 zone (the recent breakdown zone).
The 100 simple moving average (4-hours) is also near the $200 level to act as crucial hurdle. A successful close above the $200 level and the 100 SMA is needed to start a fresh uptrend.
Technical Indicators
4 hours MACD – The MACD for ETH/USD is gaining momentum in the bearish zone.
4 hours RSI – The RSI for ETH/USD is currently near the oversold zone at 26.
Major Support Level – $175
Major Resistance Level – $200


