

It’s been all about Bitcoin (BTC) in recent months with altcoins suffering as a result and BTC dominance reaching a new local high of 67.5% over the past few days.
However, a reversal typically occurs once altcoins start to show such major weakness and altcoin traders are in depression. The leading indicator for such a U-turn is Ether (ETH), which is now in a do or die position against its BTC pair.
New higher high for ETH in first uptrend since bear market
The chart above speaks for itself, showing a new uptrend since the breakout above $300 earlier this year when buyers immediately stepped in this region. This was a breakout from a multi-year accumulation range, which increases the likelihood of bull market continuation.
Since then, Ether’s price broke through $450 and continued its rally toward the recent high at $675. If that becomes the temporary top, a correction towards $450-480 is likely. However, such a correction is very healthy for the markets and should provide fuel for the next impulse wave.
Using the Fibonacci extension tool, such an impulse wave could send ETH price to $900 and possibly even $1,300.
December is historically a good month to enter altcoins
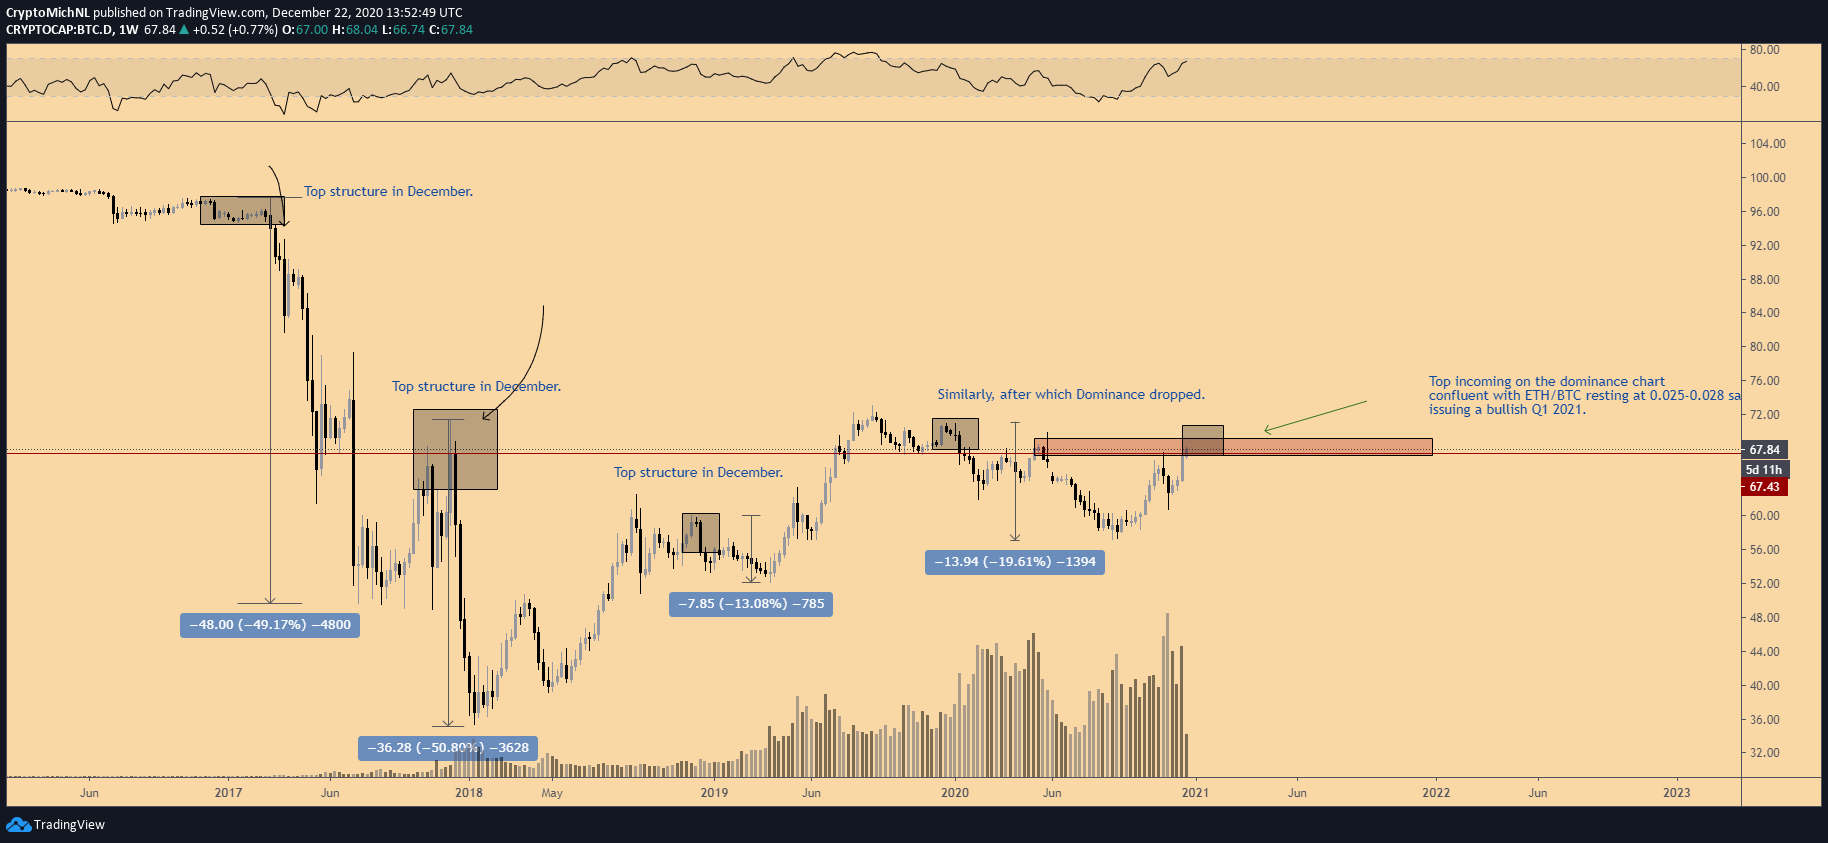
Since 2016, the Bitcoin dominance chart has topped out in the month of December, followed by a solid quarter for altcoins.
In that perspective, the Bitcoin dominance shows a clear resistance zone at the 67%-69% level. It’s hard to call this a resistance zone as the Bitcoin dominance chart isn’t an asset that can be traded. But technical analysis can still be useful in this case.
If the dominance reverses here, then another lower high will be constructed resulting in another top for December.
Given that the cryptocurrency market is in a bull cycle for the first time since January 2018, the potential altcoin run may become relatively big in scope. Such a rally could also see Bitcoin dominance dro to 48%-50%.
ETH/BTC must bounce to show strength
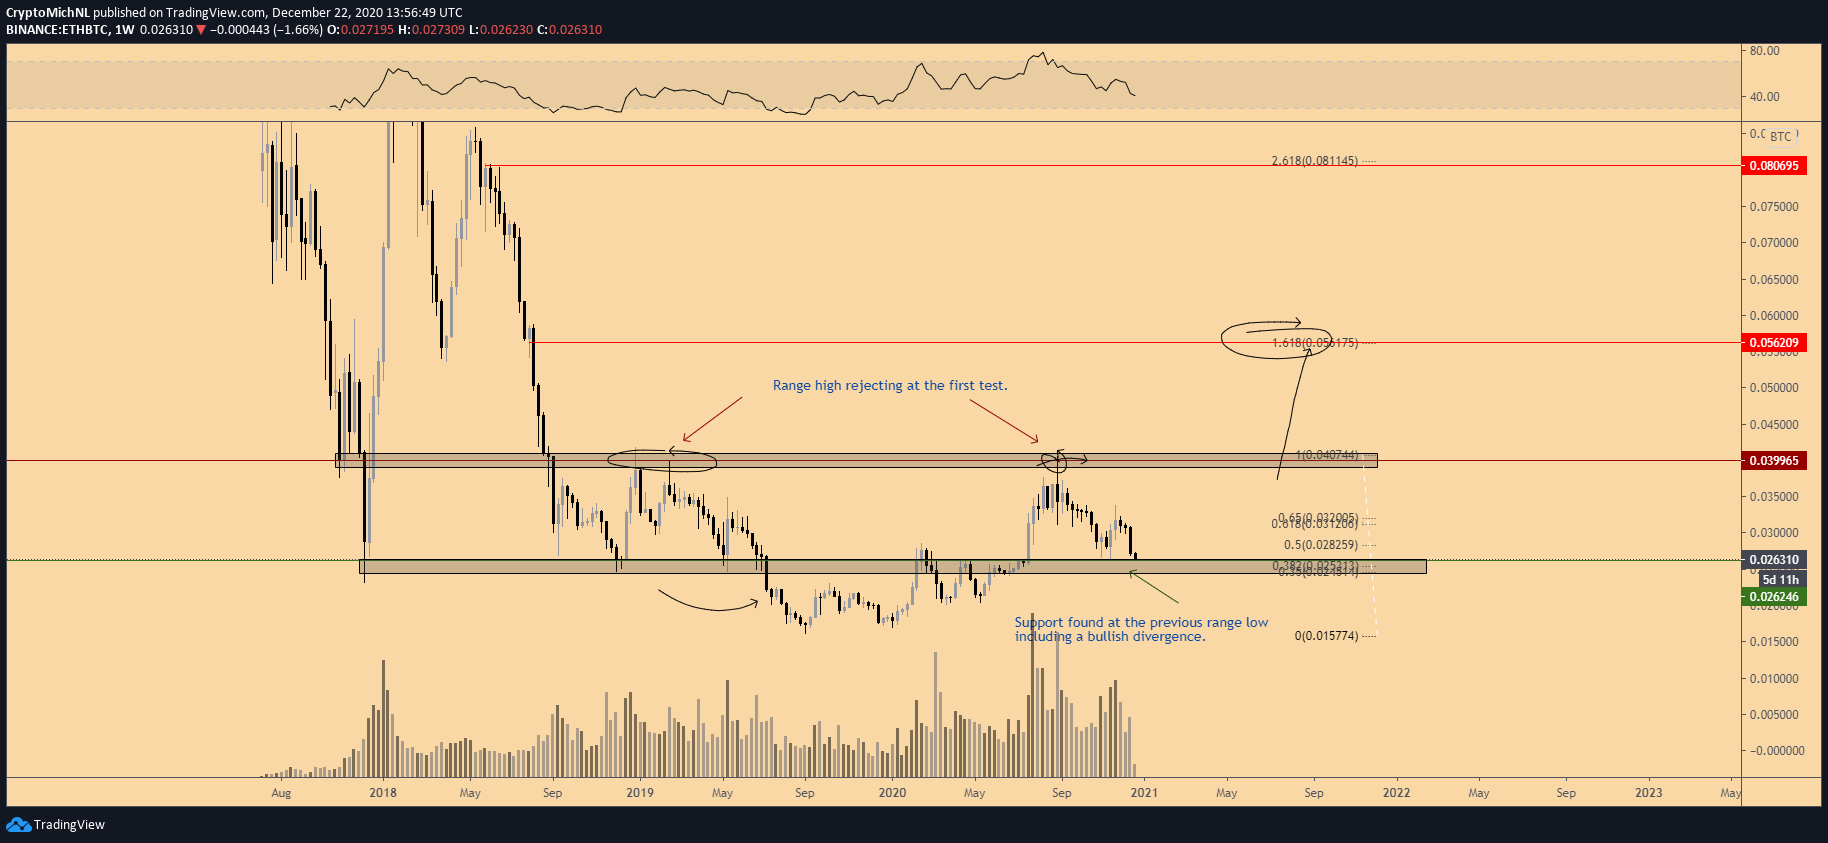
The weekly chart for ETH/BTC tells the whole story. A breakout above the 0.026 sats earlier this year propelled the price even higher with Ether rallying toward 0.04 sats — the range resistance from the previous accumulation period. This resistance couldn’t break in one-go, after which ETH/BTC dropped significantly.
The primary point of interest now is the range between 0.0245-0.026 sats as that zone used to be the resistance. As long as this area holds, more upside should be expected in the first quarter of 2021.
However, altcoins do not perform well when Bitcoin is volatile. Therefore, Ether and altcoin traders should keep an eye on Bitcoin, which needs to stabilize and/or consolidate to ensure a strong breakout.
The views and opinions expressed here are solely those of the author and do not necessarily reflect the views of Cryptox. Every investment and trading move involves risk. You should conduct your own research when making a decision.
 Skyrockets Over 43% And Smashes $2 Threshold, Setting Sights On New All-Time Highs")

