

Cosmos (ATOM) has maintained so much bullish sentiment topping the charts in the crypto space; despite pullbacks across the market, Cosmos (ATOM) would recover with good volume and rally higher. The price has been faced with resistance on the weekly chart and has shown weakness as much doubt sets in if the price can reclaim the price of $20. (Data from Binance)
Cosmos (ATOM) Token Price Analysis On The Weekly Chart
ATOM saw a decline in its price from $45 to around $6, with an over 70% drop from its all-time high despite having good fundamentals. The price of ATOM bounced off after touching a weekly low of $6, and the price rallied to $17, showing some great strength.
The price of ATOM on the weekly chart showed great strength rallying to $17 with strong volume, but the price was faced with major resistance at $17 on the weekly chart. ATOM failed to flip this weekly resistance into support as the price has maintained a decline but above its bullish trendline support.
For the price of ATOM to trend higher price needs to flip the weekly resistance into support and close above $17; if the price of ATOM fails to rally back to this region, we could see the price of ATOM retesting its support of $12.
The price of ATOM could retest its weekly support of $12, which is a healthy retracement. So far, the support of that region holds the price of ATOM from sell-off, and this would be a good zone for more buy orders, and a possible bounce as the price aims to maintain its bullish sentiment. If the price of ATOM fails to hold $12 support, we could see the price going to a low of $8.
Weekly resistance for the price of ATOM – $17.
Weekly support for the price of ATOM – $12.
Price Analysis Of ATOM On The Daily (1D) Chart
The daily timeframe for ATOM prices continues to main the bullish structure it has formed as the price respects the trendline support holding up nicely despite seeing more sell volume.
ATOM’s price needs to hold above this trendline support for the price to bounce and trend higher, but if the price of ATOM fails to hold, we could see the price of ATOM going to a daily low of $12.5.
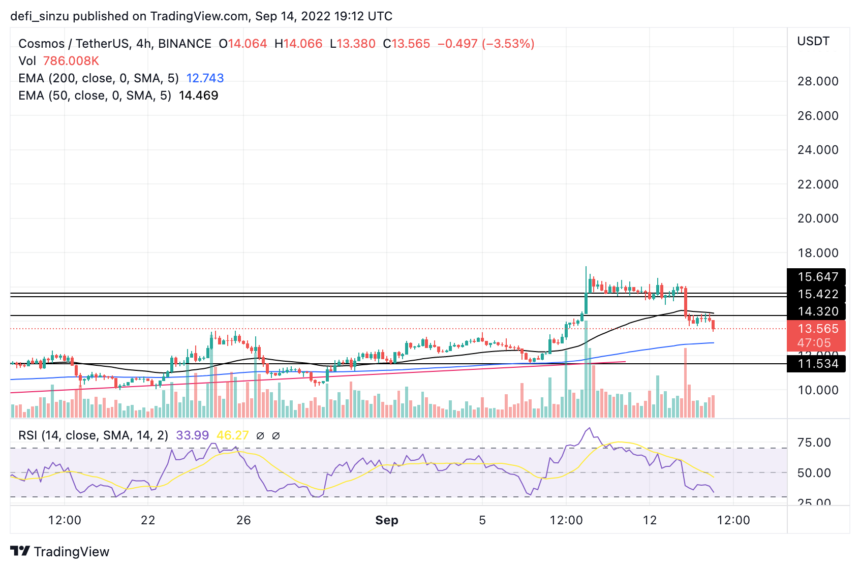
On the daily timeframe, the price of ATOM is currently trading at $13.56, holding above the 50 Exponential Moving Average (EMA), acting as support for ATOM price. The price of $12.5 corresponds to the support at 50 EMA, acting as a good area for more demand for the price of ATOM; if the support at 50 EMA fails, we could see the price going to $9.
The Relative Strength Index (RSI) for ATOM is above 50 on the daily chart, indicating low buy order volume.
Daily resistance for the ATOM price – $15.
Daily support for the ATOM price – $12.5-$9.
Featured Image From zipmex, Charts From Tradingview
 Gearing For Another Lift-Off to $0.24: Rally Isn’t Over Yet")

