

Chainlink (LINK) seems to be forming a short-term top near $12.98. A head and shoulders pattern is likely forming, which could trigger a sharp decline below the $11.50 support.
- Chainlink token price started a fresh decline after it failed to clear the $13.00 resistance against the US dollar.
- The price is holding the $11.50 support level and the 100 simple moving average (4-hours).
- There is a crucial contracting triangle forming with resistance near $12.00 on the 4-hours chart of the LINK/USD pair (data source from Kraken).
- A head and shoulders pattern seems to be forming with support near $11.40-$11.50.
Chainlink (LINK) Price Remains At Risk
This past week, we saw a sharp increase in chainlink (LINK) above the $11.50 and $12.00 resistance levels. The price even broke the $12.50 resistance and settled well above the 100 simple moving average (4-hours).
A new monthly high was formed near $12.98 and the price recently started a downside correction. There was a break below the $12.00 support level. The bears were able to push the price below the 23.6% Fib retracement level of the upward move from the $9.79 swing low to $12.98 high.
LINK price found support near the $11.40 zone and it remained well bid above the 100 simple moving average (4-hours). The 50% Fib retracement level of the upward move from the $9.79 swing low to $12.98 high also acted as a support.
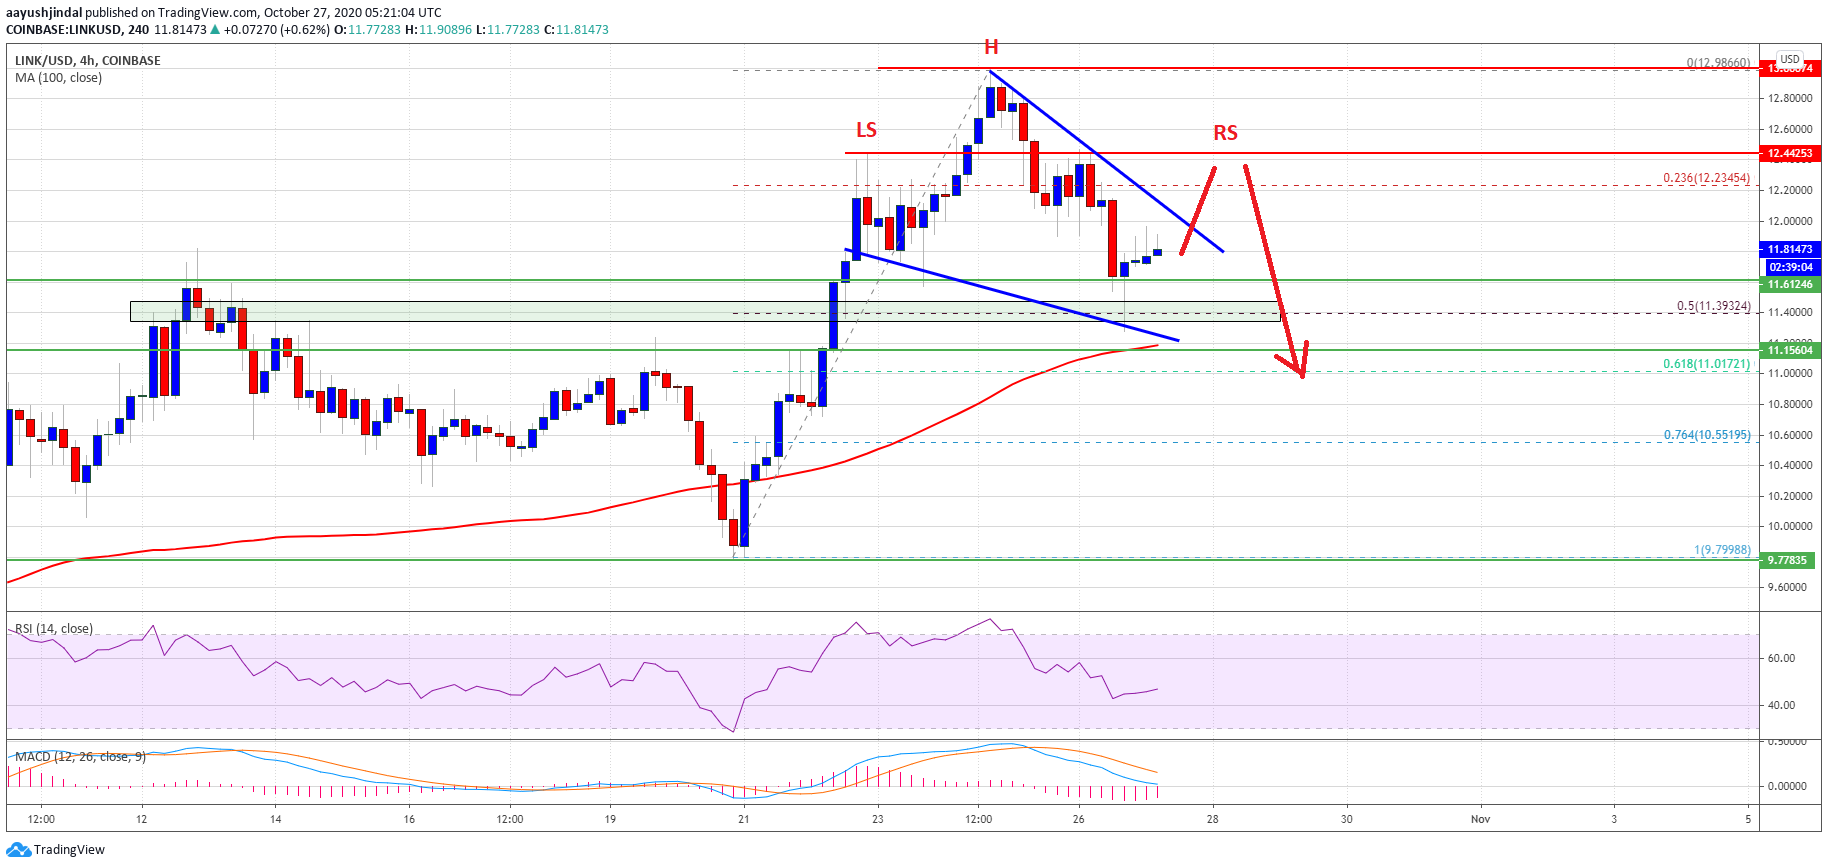
Source: LINKUSD on TradingView.com
It is currently consolidating losses (similar to Ethereum and ripple), but facing a couple of key hurdles. It seems like is a crucial contracting triangle forming with resistance near $12.00 on the 4-hours chart of the LINK/USD pair.
More importantly, there is a potential head and shoulders pattern forming with support near $11.40-$11.50. If the price climbs towards the $12.40 resistance and fails to continue higher, there is a risk of a sharp decline. In the stated case, the price could decline heavily below the $11.40 support and the 100 SMA.
Fresh Increase?
If chainlink’s price breaks the triangle resistance and accelerates above the $12.40 resistance, it could invalidate the mentioned bearish scenario.
The next major resistance on the upside is still near the $13.00 zone. A successful close above the $13.00 level might open the doors for a push towards the $15.00 resistance in the coming days.
Technical Indicators
4-hours MACD – The MACD for LINK/USD is losing pace in the bearish zone.
4-hours RSI (Relative Strength Index) – The RSI for LINK/USD is now well below the 50 level.
Major Support Levels – $11.60, $11.50 and $11.40.
Major Resistance Levels – $12.00, $12.40 and $13.00.


