

Chainlink (LINK) is down 10% and it broke the key $11.30 support zone against the US Dollar. The recent breakdown suggests high chances of more losses below $10.00 and $9.50.
- Chainlink token price failed to clear the $13.50 resistance and declined steadily against the US dollar.
- The price is now trading below the key $11.30 support and the 100 simple moving average (4-hours).
- There was a break below a major contracting triangle with support near $11.80 on the 4-hours chart of the LINK/USD pair (data source from Kraken).
- The pair remains at a risk of a sharp decline below the $10.00 and $9.50 support levels in the near term.
Chainlink (LINK) is Diving
After a sharp decline, chainlink (LINK) found support near the $9.20 level against the US Dollar. The price started a decent recovery wave above the $11.00 and $12.00 levels, but it failed to clear the $13.50 resistance zone.
It even remained well below the $14.00 pivot level and the 100 simple moving average (4-hours). Conversely, there were positive moves in bitcoin above $10,700 and Ethereum remained well bid above the $355 support.
LINK is currently declining and it broke the 50% Fib retracement level of the upward move from the $9.20 low to $13.43 high. More importantly, there was a break below a major contracting triangle with support near $11.80 on the 4-hours chart of the LINK/USD pair.
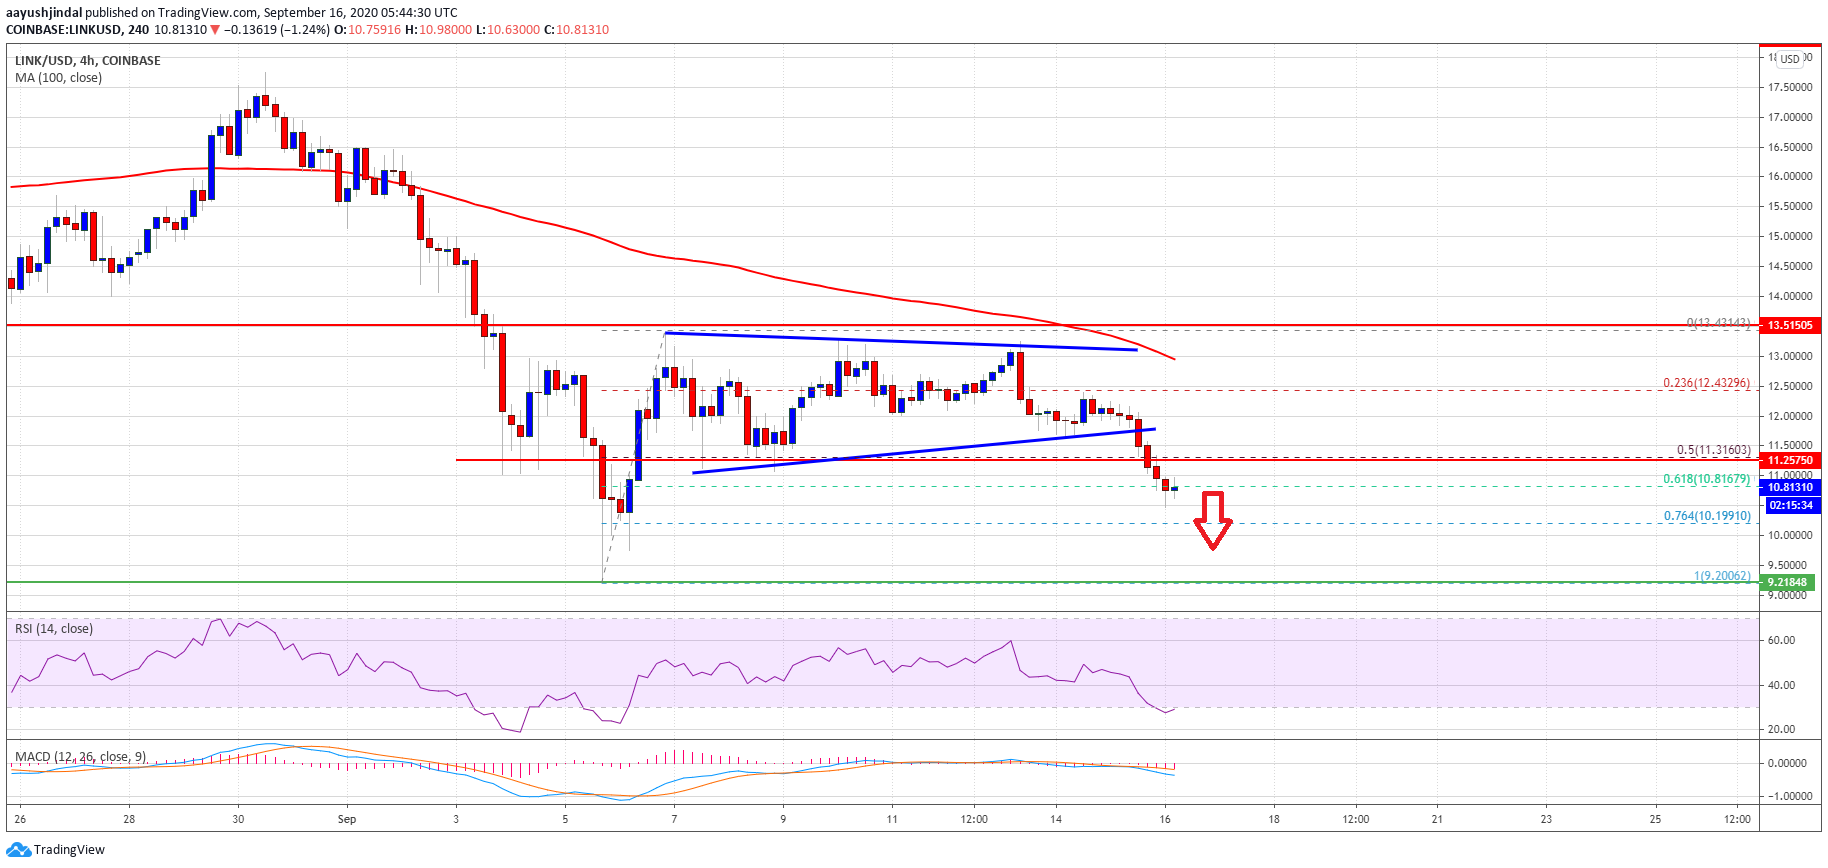
LINK price breaks $11.000. Source: TradingView.com
The pair is now trading below the key $11.30 support and the 100 simple moving average (4-hours). It is testing the 61.8% Fib retracement level of the upward move from the $9.20 low to $13.43 high.
It seems like the bulls might struggle to protect losses and the price might decline further below $10.50. The next key support is near the $10.00 level, below which the bears are likely to aim a new monthly low below the $9.20 level.
Upsides Likely to be Capped?
If chainlink’s price starts an upside correction, the price might face sellers near the $11.30 level (the recent breakdown zone and now a major hurdle).
The main hurdle is near the $13.00 level and the 100 simple moving average (4-hours). A close above the $13.00 and $13.50 resistance levels is must to start a steady recovery wave in the near term.
Technical Indicators
4-hours MACD – The MACD for LINK/USD is now gaining pace in the bearish zone.
4-hours RSI (Relative Strength Index) – The RSI for LINK/USD is well below the 35 level.
Major Support Levels – $10.50, $10.00 and $9.20.
Major Resistance Levels – $11.30, $13.00 and $13.50.


