

Bitcoin has entered the week with upside price action into the mid-levels of its current levels. However, bulls face hurdles as an increase in selling pressure set back BTC’s price from $66,000 to a current price of $64,262 at the time of writing.
Bitcoin entered a consolidation zone after a flash crash pushed its price from the high of its current levels to the critical support at around $62,500. The bullish sentiment seems to be fading as uncertainty takes over the market.
Related Reading | Bitcoin Eyes Fresh Rally, Why Close above $66k Is Important
Many traders were expecting a more decisive price action from the benchmark cryptocurrency and a clearer path towards a short-term price target above $70,000 and ultimately $100,000. Macroeconomic variables seem to be playing against BTC’s price rally.
The U.S. FED Chair Jerome Powell hinted at the beginning of tapering which could remove liquidity from global markets. In addition, the crisis with Chinese real-estate giant Evergrande continues to wreak havoc across the financial sector with many investors fleeing to the U.S. dollar.
As seen below, the U.S. Dollar Index (DXY) has been trending to the upside since November 10th. At the same period, Bitcoin took its dive to the lower $60,000s bringing the entire crypto market with it.
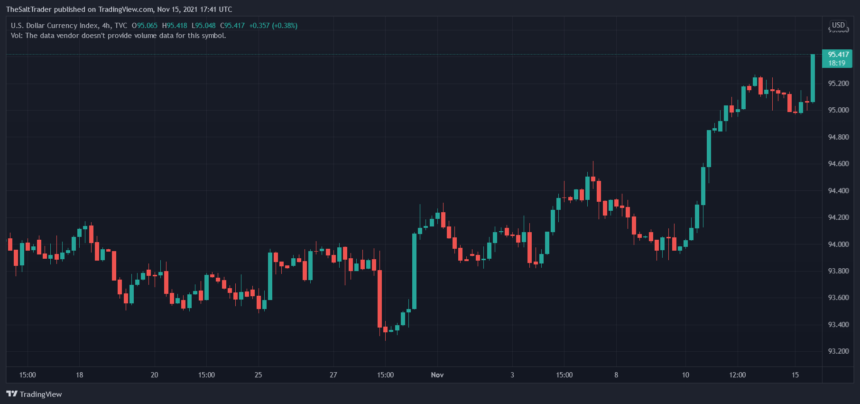
In the short term, there seems to be an inverse correlation between Bitcoin and the DXY. If the U.S. currency gains more strength, BTC’s price could revisit the critical support zone around $62,000.
In that scenario, bulls could face further obstacles. Data from Material Indicators Indicates that Bitcoin has lost some support below $64,000.
Related Reading | This Is Hilarious: Bitcoin Denier Steve Hanke Is Into Ethereum Now
As the Fire Chart below shows, there were $21 million in bids (in red below Bitcoin’s price display in blue) for BTC before it was rejected at $66,000. At present, there are less than $15 million in bids with an additional $28 million but much lower at $61,500.
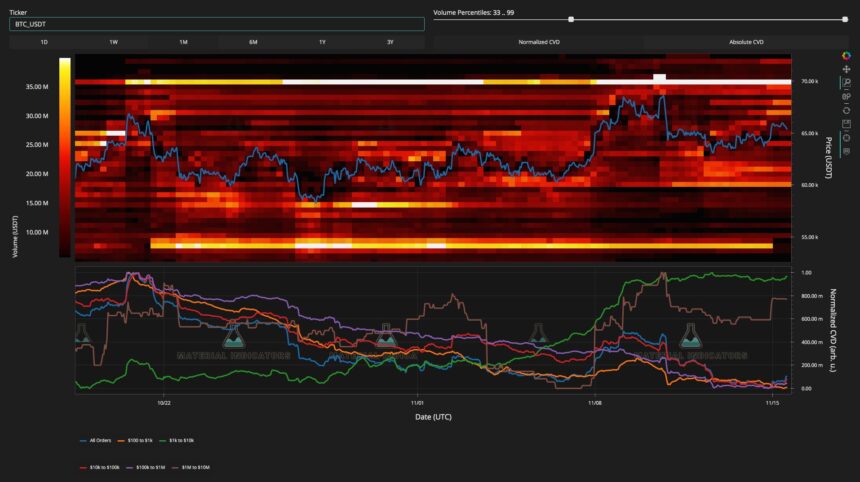
This suggests that Bitcoin could continue to trend to the downside in the short term. Below $60,000 there was a massive bid wall that was removed at $54,000, but this could imply bullish continuation for Bitcoin or at least more support around $60,000, important support that zone that must be held in order to resume the rally.
As Material Indicators claimed:
(…) a massive ladder of BTC bids down to $54k has been pulled. It’s not a rugpull. They couldn’t get filled that low as the buy zone has moved up.
Bitcoin In Crab Like Price Action, What Are The Price Targets?
On higher timeframes, the Bitcoin Taproot upgrade failed to become a bullish catalyzer as operators were already pricing in the event. In the long term, the improvements made to the BTC network will certainly be a tailwind for the underlying’s asset price.
According to Yuya Hasegawa, an analyst at BitBank, the price of BTC dropped due to the U.S. SEC rejection of its linked spot ETF filed by investment firm VanEck.
Related Reading | Crypto Analyst Says Bitcoin Won’t Hit $100,000 This Year, When Will It Hit?
The price experienced a relatively fast recovery as the stock market trend to the upside, but the analyst expects the price to remain rangebound between $58,000 to $69,000 with a potential for a new all-time high at around $76,000.


