

The flagship cryptocurrency continues to disappoint investors while lower-cap coins are running the show. Indeed, Bitcoin has been flat for over the past month without providing a clear roadmap of where its price could be headed next.
The ongoing consolidation period forced the Bollinger bands to squeeze on BTC’s 1-day chart. Squeezes are indicative of low volatility periods that tend to be succeeded by wild price movements. The longer the squeeze, the higher the probability of a strong breakout.
Bollinger Bands Squeeze on Bitcoin's 1-day Chart. (Source: TradingView)
Since this technical index fails to indicate what will be the trend’s direction, a look at Bitcoin’s on-chain metrics could provide a few clues.
On-Chain Metrics Favor the Bitcoin Bears
The NVT ratio is a widely used indicator among some of the most prominent analysts in the industry. It takes into consideration the number of unique tokens being transacted on the network with respect to a given crypto’s price action.
Bitcoin’s network activity is currently depreciating due to the lackluster price action of the past month and the shift in investors’ focus towards pumping altcoin. Such a decline in the network’s utilization is a negative sign, and it may suggest that BTC is poised for a downswing in the days or weeks ahead.
“Part of the reason it plunged in the first place is because the month of June was signaling a bearish divergence on our NVT model as well. And with so much attention heavily weighted on altcoins right now, it’s not surprising that BTC is starting to see some concerning neglect,” said Brian Quinlivan, Marketing and Social Media Director at Santiment.

Bitcoin's NVT Ratio Turns Bearish. (Source: Santiment)
Moreover, the daily active addresses on the Bitcoin network are also discouraging. Quinlivan maintains that ever since the halving took place BTC has been trading sideways within a narrow trading range. Since there has not been any “major extreme movement in either direction,” its future looks “quiet and inconclusive.”

Bitcoin's Daily Active Addresses Look Quiet and Inconclusive. (Source: Santiment)
Strong Support and Resistance
The signs of inconclusiveness that Bitcoin’s daily active addresses show are also seen on IntoTheBlock’s “In/Out of the Money Around Price” (IOMAP) model. This fundamental index reveals the support and resistance zones where the pioneer cryptocurrency has been contained are quite strong.
Based on the IOMAP cohorts, roughly 1.6 million addresses had previously purchased nearly 1 million BTC around $9,060. Meanwhile, 2.5 million addresses bought 1.5 million BTC around $9,280.
Holders within the higher range appear to be selling their tokens each time Bitcoin rises while those in the lower range are trying to remain profitable during each downswing. These two trading groups are compressing the price action into a narrower trading range until one side breaks.
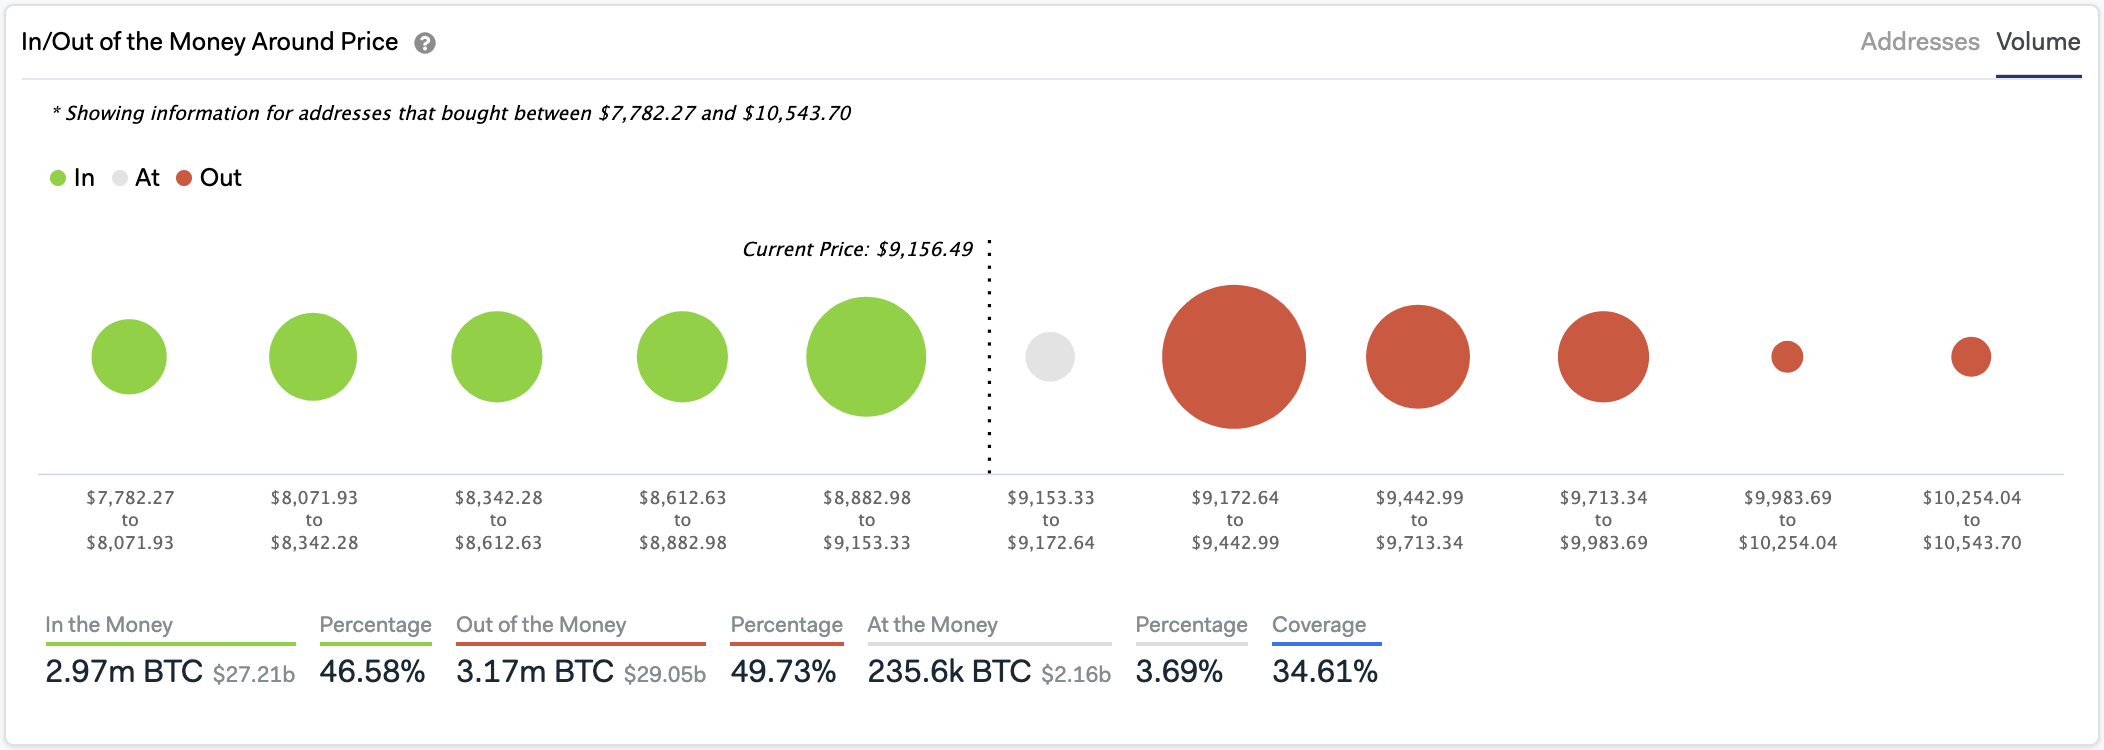
Bitcoin Contained Between Two Major Supply Barriers. (Source: IntoTheBlock)
Until that happens, Bitcoin would likely remain stagnant. For this reason, investors must pay close attention to the $9,060 and $9,280 hurdles since they will determine where BTC heads next.
Featured Image by Depositphotos
Price tags: btcusd
Chart from TradingView.com


