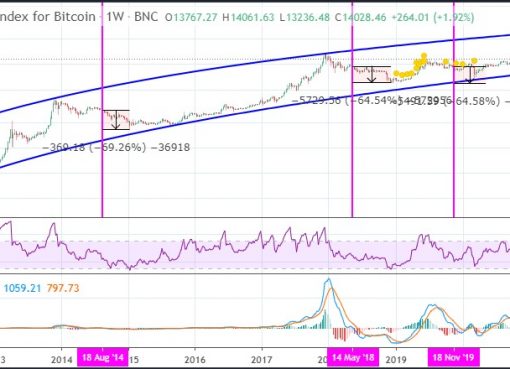
A widely tracked bitcoin price indicator is about to turn bullish – potentially accelerating the recent uptrend of the top cryptocurrency by market value.
The 50-day moving average (MA) of bitcoin’s price looks set to cross above the 200-day MA within two to three days. The resulting “golden crossover,” a long-term bull market indicator, would be the first since Feb. 18 and only the seventh in bitcoin’s lifetime, as per CryptoX’s Bitcoin Price Index.
“The golden crossover will catch the attention of classical trend followers,” said Su Zhu, CEO of Three Arrows Capital.
Trend-following traders do not predict or forecast specific levels, but simply join the trend (bullish or bearish), when they feel that a strong directional bias has been established. They often employ moving average crossover strategies to decide whether a trend is developing. This is because averages, which are based on past data, crowd out the noise created by intraday fluctuations and paint a better picture of the broader trend.
When a short-term MA moves above a long-term MA, a bullish cross is confirmed. That is considered a buy signal by trend followers. Alternatively, a bear cross is taken as a sell signal.
Thus, the impending golden cross, once confirmed, could bring in additional buying pressure from traders who employ MA strategies, leading to stronger price gains.
“I think MA strategies often work because they are self-reinforcing,” said Anthony Vince, head of trading at GSR. That viewpoint has logic as averages follow price and produce a bull cross following notable price gains. Once the cross is confirmed, more buyers join the market, potentially pushing prices higher.
Lennard Neo, lead analyst at Stack, also expects the upcoming golden cross to bode well for the cryptocurrency. “Moving averages tend to be one of the best performing strategies when applied to crypto, at least for the past couple of years. We expect the same to happen in this potential golden cross, as BTC should see some upward price pressure,” said Neo.

Indeed, the golden cross that took place last April yielded more than 130% returns over just a 64-day period. Meanwhile, the golden cross witnessed in October 2015 was followed by a quickfire 64% rally in just eight days.
Some observers, however, are of the opinion that moving average crossovers are lagging indicators and often trap investors on the wrong side of the market. After all, MA studies are based on past data and tend to lag prices.
In the past, there have been instances where the golden crossover turned out to be a bull trap.

“The last golden cross was confirmed before black Thursday and the last death cross was confirmed before the April rally,” said Darius Sit, co-founder and managing director at Singapore-based QCP Capital.
“The July 2014 cross for instance, yielded -23% returns from cross up to cross down,” crypto research firm Digital Assets Data told CryptoX.
So, if history is a guide, golden crossover is an unreliable indicator of price trends.
Different this time?
What makes the upcoming golden cross different from some previous ones is the fact that it is supported by bullish fundamental developments.
The rewards per block mined on bitcoin’s block chain were cut to 6.25 BTC from 12.50 BTC last Monday. Most analysts expect the supply cut to put bitcoin into a long-term bull market, similar to the one seen in the months following the second reward halving, which took place in July 2016.
Additionally, the challenging macro environment brought on by the coronavirus outbreak and the unprecedented monetary stimulus launched by major central banks is expected to boost haven demand for bitcoin.
Hence, some analysts see a low probability of the upcoming bull cross turning out to be a bull trap. “Fundamentals and technicals are lining up well for the markets now, “ said Zhu.
Meanwhile, Neo said that “the fundamentals of bitcoin remain strong, which contemplates every reason for a break upside.”
The on-chain activity does show a strong holding sentiment in the investor community. “The number of bitcoins held on exchanges has been steadily decreasing since the crash in March, and is now approaching a one-year low. This is the largest and most prolonged BTC exchange balance downtrend in Bitcoin’s history,” Glassnode, a blockchain intelligence firm, noted in its weekly report.
Investors typically move bitcoins from their wallets to exchanges when they expect prices to drop. On the other hand, coins held on exchanges are withdrawn when the cryptocurrency is expected to see a sustainable price rise.
At press time, bitcoin is changing hands near $9,800, representing a 0.6% gain on the day. The cryptocurrency found bids below $9,500 early on Tuesday, but is yet to cross above $10,000. The area around that level has proved a tough nut to crack over the past few days.
With both fundamentals and technicals biased bullish, a move above $10,000 may happen soon. “A successful break higher and the next significant level overhead would be the 61.8% Absolute Fib at $12,160 area,” said Eddie Tofpik, head of technical analysis and senior markets analyst at London-based ADM Investor Services International Ltd.
However, over the past few days, the buyers have consistently struggled to keep gains above $9,840, as seen on the daily line chart. “Another failure there could see the forming of a possible double top and contemplation of the $6,000 area,” said Tofpik.
Disclosure: The author holds no cryptocurrency at the time of writing.
Disclosure Read More
The leader in blockchain news, CryptoX is a media outlet that strives for the highest journalistic standards and abides by a strict set of editorial policies. CryptoX is an independent operating subsidiary of Digital Currency Group, which invests in cryptocurrencies and blockchain startups.


