

Bitcoin is down more than 5% from the $7,470 swing high against the US Dollar. BTC is now trading near a crucial support at $6,700 and the 100 SMA (H4).
- Bitcoin started a fresh decline from the $7,470 monthly high and traded below $7,000.
- There is a crucial support forming above $6,700 and the 100 simple moving average (4-hours).
- There was a break below a major bullish trend line with support at $7,200 on the 4-hours chart of the BTC/USD pair (data feed from Kraken).
- The pair could start a strong rally if it stays above the $6,700 support and the 100 SMA (H4).
Bitcoin is Testing Crucial Support
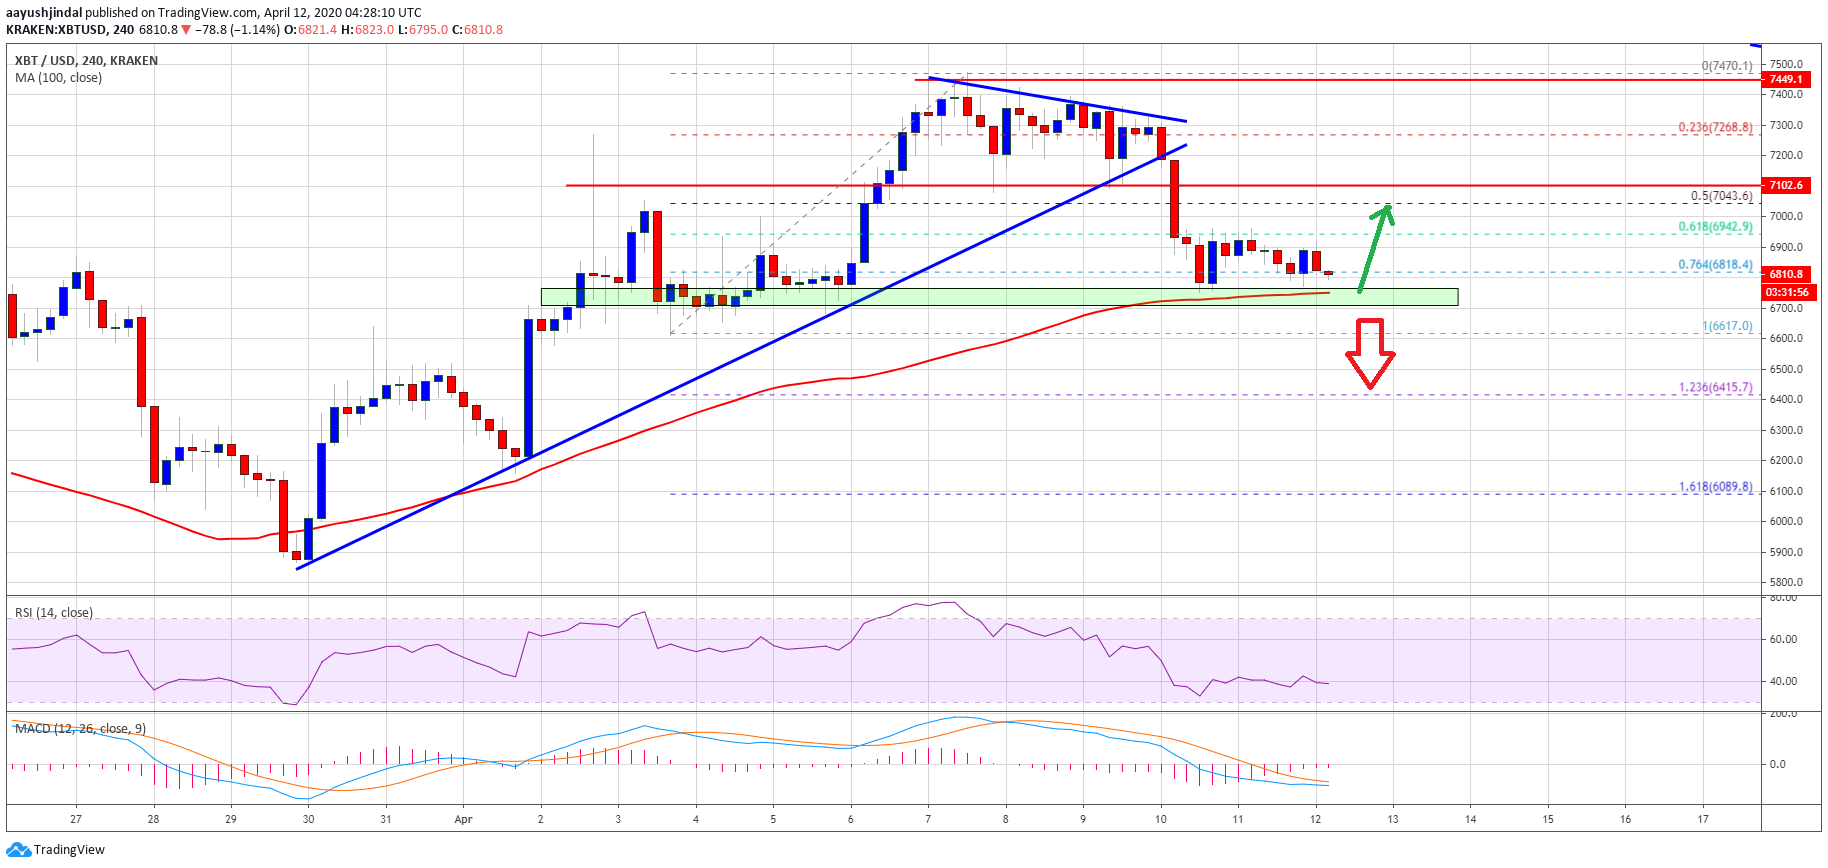
This past week, bitcoin made a few attempts to surpass the $7,400 and $7,500 resistance levels against the US Dollar, but it failed. BTC price traded as high as $7,470 and recently started a fresh decline.
It broke the $7,200 support level to move into a bearish zone. The bears pushed the price below the 50% Fib retracement level of the upward move from the $6,617 low to $7,470 high.
More importantly, there was a break below a major bullish trend line with support at $7,200 on the 4-hours chart of the BTC/USD pair. Bitcoin price is now trading near a crucial support at $6,700 and the 100 simple moving average (4-hours).
It is also trading near the 76.4% Fib retracement level of the upward move from the $6,617 low to $7,470 high. If the price fails to stay above the $6,700 support and the 100 SMA (H4), there is a risk of more losses in the near term.
The next key support is near the $6,400 area since it is close to the 1.236 Fib extension level of the upward move from the $6,617 low to $7,470 high. Any further losses may perhaps lead the price towards the $6,080 support area in the near term.
Fresh Rally?
If bitcoin stays above the $6,700 support and the 100 SMA, it could start a fresh increase. An initial resistance on the upside is near the $6,950 and $7,000 levels.
The first major resistance is seen near the $7,100 level, above which the price is likely to gain strength. The next key resistance is near the $7,400 and $7,500 levels.
Technical indicators
4 hours MACD – The MACD for BTC/USD is about to move into the bullish zone.
4 hours RSI (Relative Strength Index) – The RSI for BTC/USD is currently flat near the 40 level.
Major Support Level – $6,700
Major Resistance Level – $7,000
Take advantage of the trading opportunities with Plus500
Risk disclaimer: 76.4% of retail CFD accounts lose money.

 Holding Crucial Support, Why It Could Surge Again")
 Breaks Out Of Long Isolation, Is This A Fake Rally?")