

Bitcoin has seen some brutal price action throughout the morning, with overleveraged long positions being shaken out with a brief dip down to $15,700, while those panic shorting were then liquidated by a sharp rebound.
This price action has allowed the cryptocurrency to begin inching higher and moving to retest its $16,000 support level, which could once again act as slight resistance.
This level has been acting as support for the past few days, but a continued bout of trading below it could strike a heavy blow to bulls.
BTC’s recent price action seen throughout the past few days and weeks has led to the formation of a parabolic trendline, elucidating the overwhelming control that buyers have had over the benchmark cryptocurrency’s price action as of late.
However, this trendline is now being tested, and whether or not buyers can defend it should provide some serious insights into the cryptocurrency’s near-term outlook.
A break below this level could confirm its recent $16,500 highs as a long-term top.
Bitcoin Reels Below $16,000 as Selling Pressure Mounts
Following a bout of stability above $16,000, Bitcoin has faced some sudden inflows of selling pressure that have caused it to plunge beneath this key level.
This comes just one day before the cryptocurrency closes its next weekly candle, which will be vital for gaining insights into its mid-term outlook.
If it closes below $16,000, it could be a grim sign that indicates $16,500 will be a local top. A close above this level, however, could help send it flying significantly higher.
While BTC’s momentum stalls, altcoins are actually seeing some immense strength. This trend may persist so long as BTC consolidates and doesn’t see any immense decline.
BTC Tests Parabolic Trendline as Bears Try to Break Uptrend
At the moment, Bitcoin is testing a key parabolic trendline that has been formed and respected throughout the past few months.
A break below this trendline could mark an end to the intense gains that the cryptocurrency has been seeing as of late.
One trader spoke about this in a recent tweet, questioning whether or not the parabola will survive.
“BTC: Can the parabola survive?” He concisely asked while pointing to the below chart.
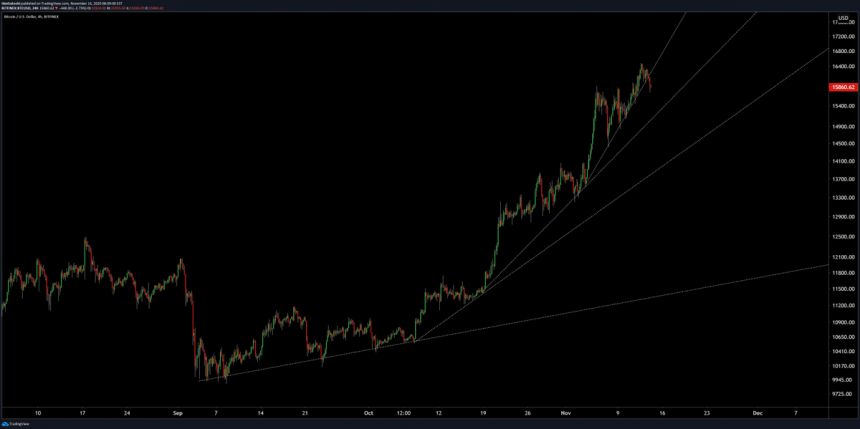
Image Courtesy of Josh Olszewicz. Source: BTCUSD on TradingView.
Tomorrow’s weekly candle close should provide greater insights into where the cryptocurrency will trend next.
Featured image from Unsplash.
Charts from TradingView.

