
Despite Bitcoin reaching new highs, the BTC SOPR data may suggest current market activity resembles that of an early bull run.
Bitcoin SOPR Shows Profit Taking Is Mild Despite New ATH
As per the latest weekly report from Glassnode, the BTC SOPR shows that the current profit taking behavior of the market is mild, even though the crypto just reached new highs.
The Spent Output Profit Ratio (or the SOPR in short) is a Bitcoin indicator that highlights whether holders as a whole are currently selling at a profit or not.
The metric’s value is calculated by taking the ratio between the value of coins at the time holders bought them, and the price at which they sold them. Simply put, it’s price sold divided by price paid.
When the indicator has values greater than one, it means the coins that were moved during the specific time period sold, on an average, at a profit.
Related Reading | 10 Bullish Monthly Bitcoin Price Charts To Start November
On the other hand, SOPR values lower than one would suggest holders sold their Bitcoin at a loss overall during the period. The metric’s value exactly equal to one means the market broke even.
Now, here is a chart that shows the trend in the value of the aSOPR indictor, which is the normal SOPR adjusted to eliminate relay transactions and other noise by not taking into account spent outputs that moved within one hour of creation:
The change in the BTC aSOPR over the course of the entire bull run | Source: Glassnode
As the above graph shows, the current Bitcoin market looks to be showing mild spending behavior with some profits.
Interestingly, similar market activity was observed in the couple of months leading up to November 2020. Back then, the bull run had only just started and BTC was yet to make a new all-time high.
This time Bitcoin has already made a new ATH, but spending behavior hasn’t shifted to sustained profit taking that was seen throughout the early part of this year.
Related Reading | Ethereum Supply Shock Deepens: Exchange Reserves Decline 18% In 5 Months
The trend may show that investors are not willing to sell at current levels as they think the price will appreciate further.
The report notes that positive aSOPR behavior with upwards or sideways price movement like right now can be constructive as it shows the market can absorb the sell side while also maintaining support levels.
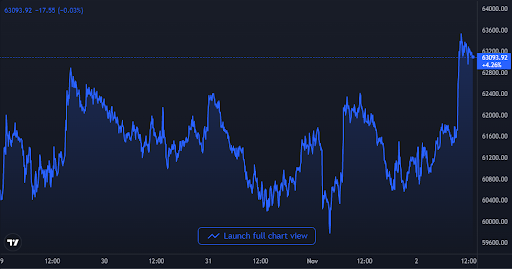
BTC's price shows a sharp movement up | Source: BTCUSD on TradingView
BTC Price
At the time of writing, Bitcoin’s price floats around $63k, up 2% in the last seven days. The above chart shows the trend in the price of the coin over the last five days.
Featured image from Unsplash.com, charts from TradingView.com, Glassnode.com


