

Bitcoin price is up over 2% and it broke the $11,800 and $12,000 resistance levels against the US Dollar. BTC is now trading above $12,000, with high chances of more upsides.
- Bitcoin remained in a positive zone and it cleared the $11,800 and $12,000 resistance levels.
- The price is currently testing the $12,150 zone and it is well above the 100 hourly simple moving average.
- There is a major bullish trend line forming with support near $11,980 on the hourly chart of the BTC/USD pair (data feed from Kraken).
- The pair is likely to accelerate higher above $12,100 and $12,200 in the near term.
Bitcoin Price is Gaining Momentum
Bitcoin price gained bullish momentum after a successful close above the $11,560 resistance. BTC even broke the $11,800 resistance and settled well above the 100 hourly simple moving average.
As a result, the bulls gained strength and they were able to push the price above the $12,000 resistance. A new weekly high is formed near $12,160 and the price is currently showing a lot of positive signs.
An initial support for bitcoin is near the $12,050 level. It is close to the 23.6% Fib retracement level of the recent rise from the $11,870 low to $12,158 high. There is also a major bullish trend line forming with support near $11,980 on the hourly chart of the BTC/USD pair.
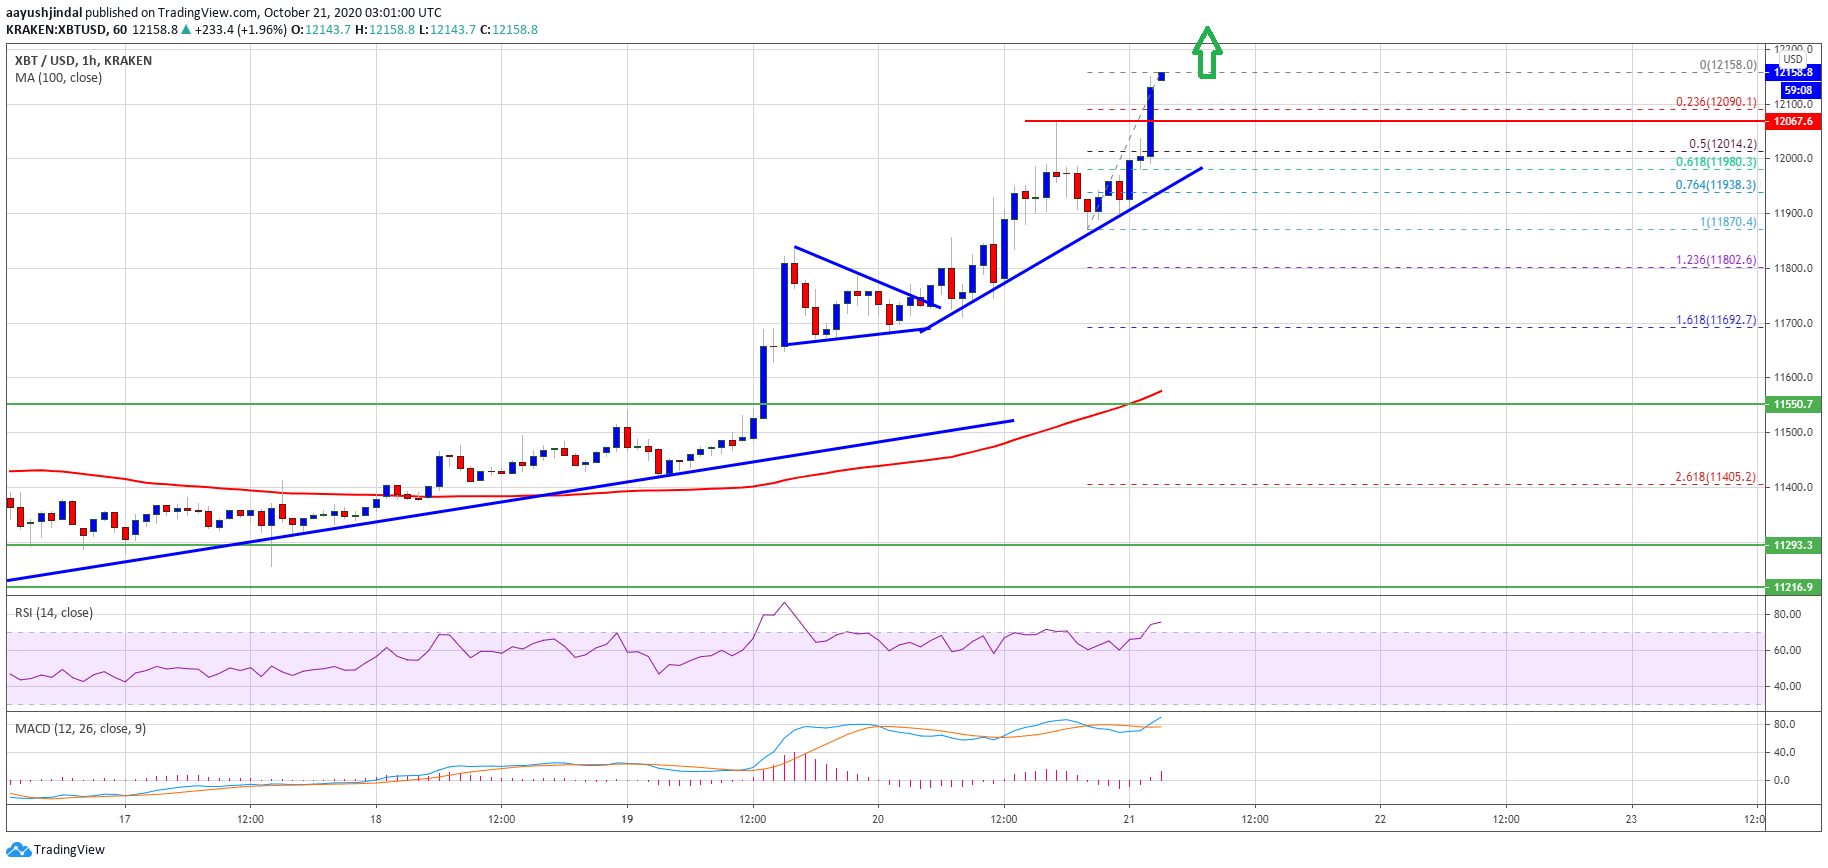
Source: BTCUSD on TradingView.com
The trend line is close to the 50% Fib retracement level of the recent rise from the $11,870 low to $12,072 high. On the upside, the $12,075 and $12,100 levels are initial barriers for the bulls.
The first major resistance is near the $12,200 level. A successful close above the $12,200 level could open the doors for a decent increase towards the $12,500 resistance level.
Downside Correction in BTC?
If bitcoin starts a downside correction, it is likely to find bids near the $12,050 and $12,000 levels. If there is a downside break below the trend line support and a close below $12,000, there could be an extended downside correction.
The next major support is near the $11,880 level, followed by the key $11,800 support level (the recent breakout zone).
Technical indicators:
Hourly MACD – The MACD is now gaining pace in the bullish zone.
Hourly RSI (Relative Strength Index) – The RSI for BTC/USD is well above the 65 level, with a positive angle.
Major Support Levels – $12,050, followed by $12,000.
Major Resistance Levels – $12,150, $11,200 and $12,500.


