

Bitcoin is back in the cryptocurrency market’s spotlight after smashing through the infamous $10,000 resistance barrier. Data from Glassnode reveals that more than 763 million Tether (USDT) flooded multiple cryptocurrency exchanges while buy orders began to pile up.
The massive capital influx allowed the flagship cryptocurrency surge and reach a new yearly high of nearly $11,500.
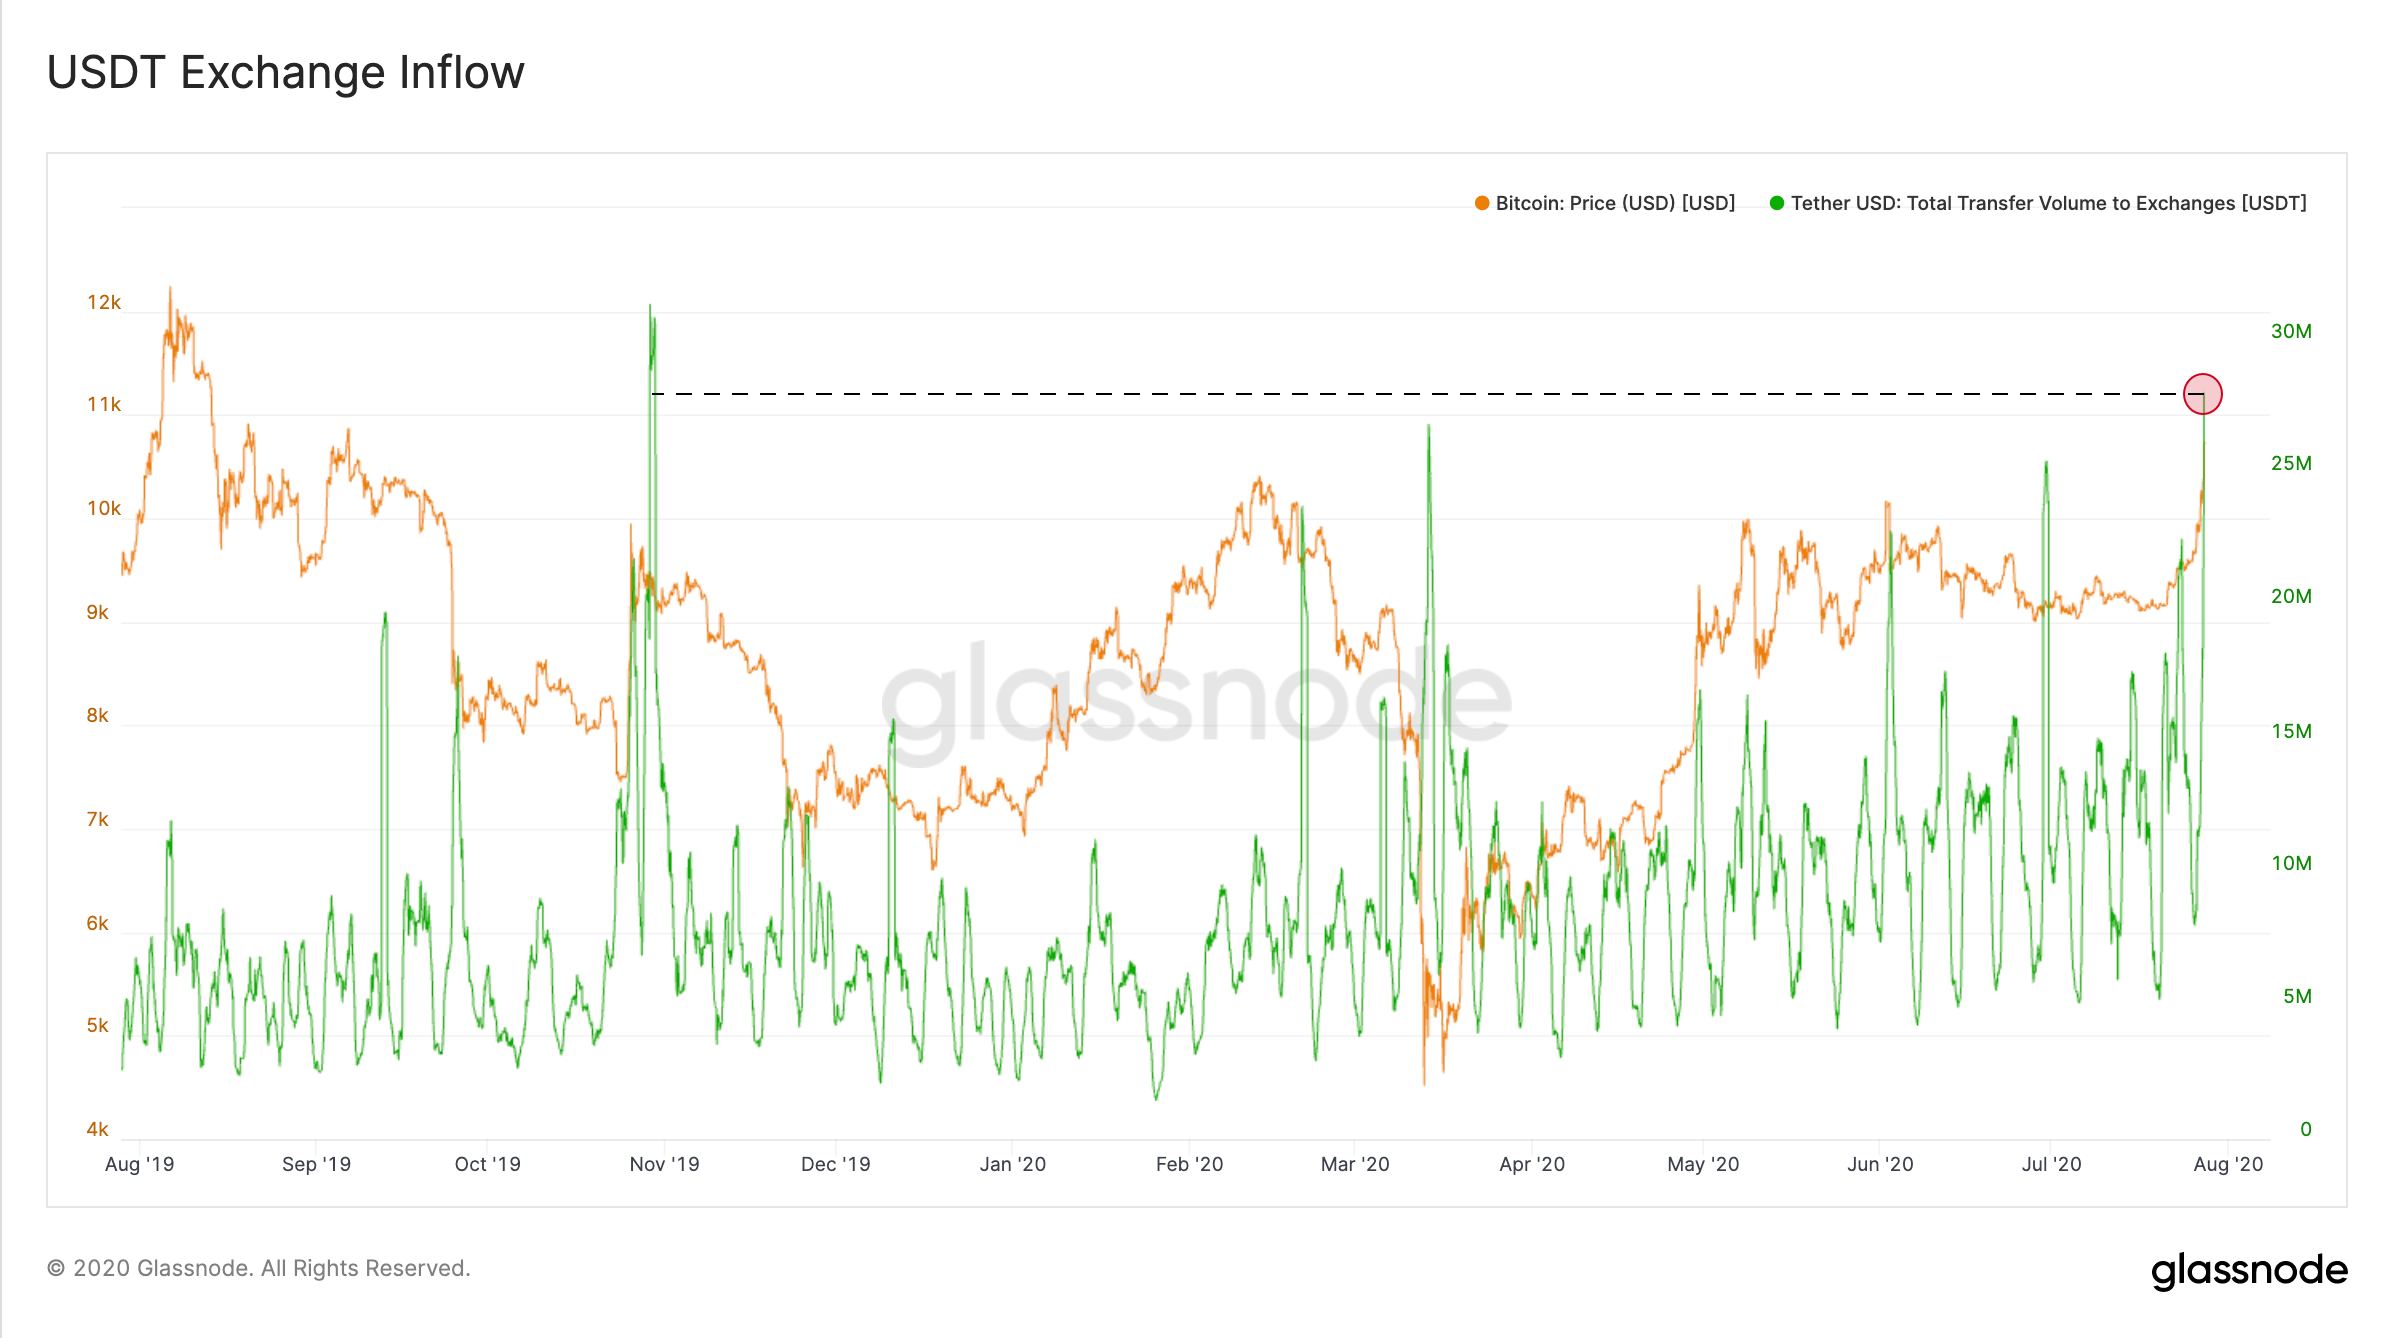
Tether Inflow to Crypto Exchanges. (Source: Glassnode)
Despite the impressive price action that Bitcoin has enjoyed over the last few days, multiple bearish signals are popping up. These may indicate that BTC sits in overbought territory, which may lead to a pullback before higher highs are reached.
Technicals Warn of a Correction Ahead of Bitcoin
Indeed, the Tom Demark (TD) sequential indicator presented sell signals across multiple time frames, including BTC’s 1-day, 9-hour, and 4-hour charts. The bearish formations developed in the form of green nine candlesticks. A sudden increase in the selling pressure behind the pioneer cryptocurrency could validate the pessimistic outlook.
If so, the TD setup estimates that Bitcoin may have the potential to retrace for one to four daily candlesticks before the uptrend resumes.
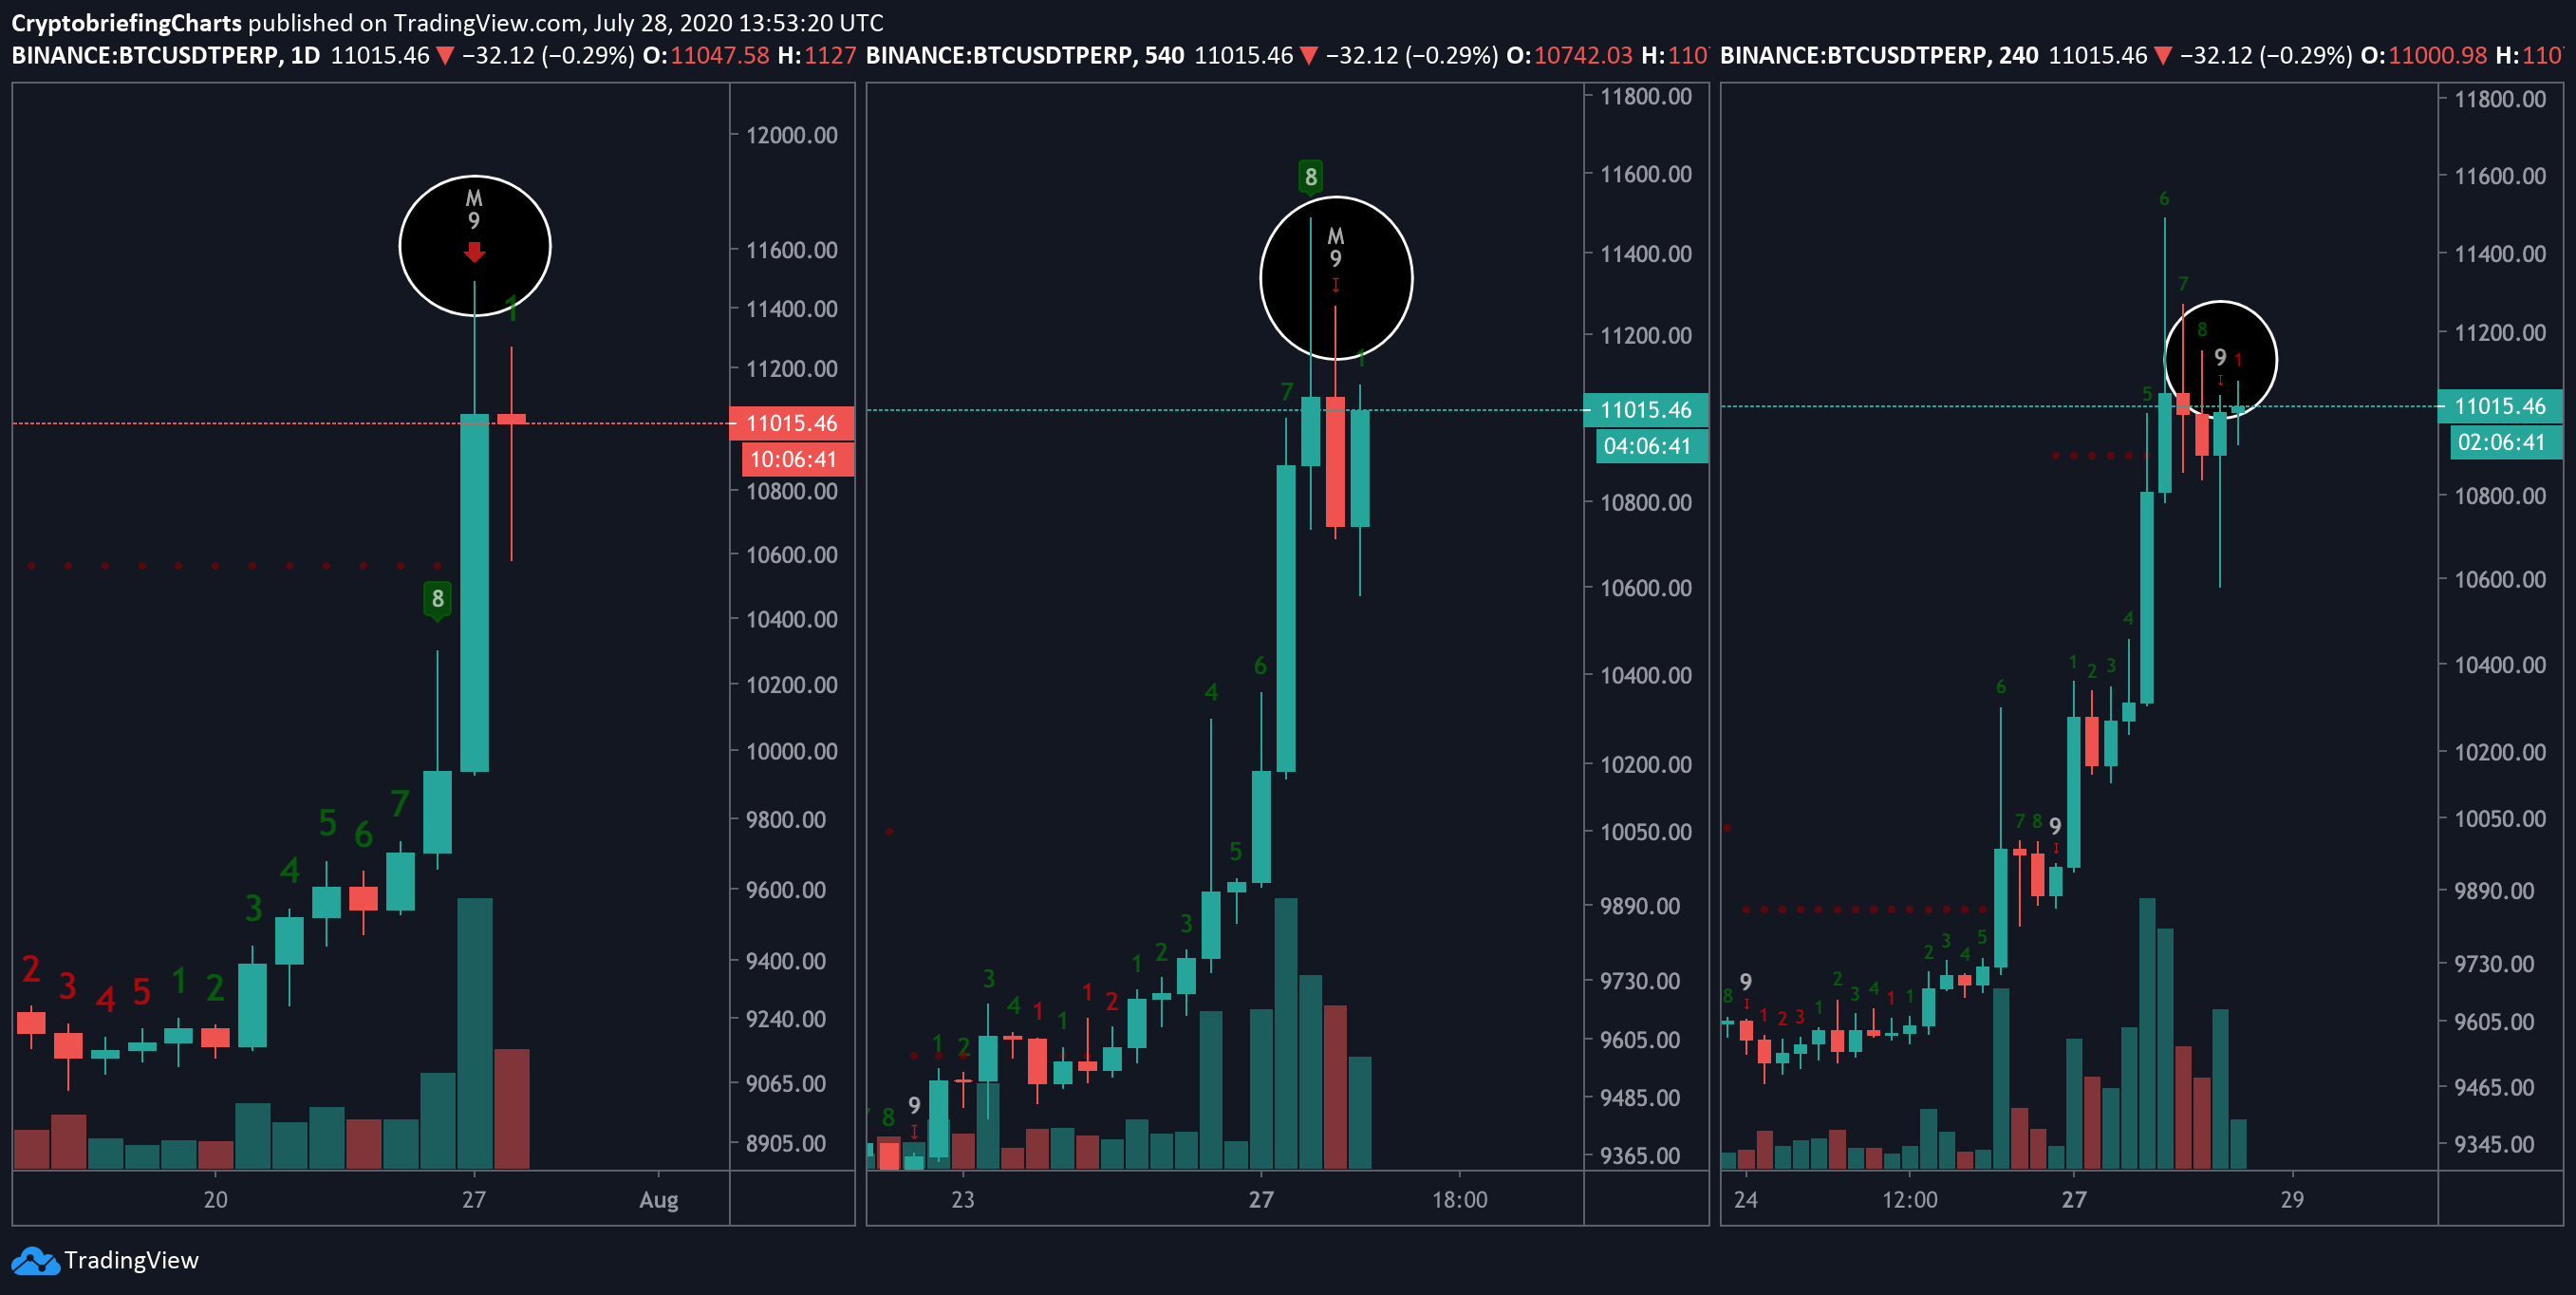
TD Presents Sell Signal Across the Board. (Source: TradingView)
The fact that the TD setup presented the same sell signal across different time frames is a reason to worry. Although market participants have grown overwhelmingly bullish after the recent price action, a retracement may help maintain the uptrend healthy. By allowing sidelined investors to re-enter the market, fresh capital may help propel BTC to higher highs.
Stiff Support Ahead
In the event of a correction, IntoTheBlock’s “In/Out of the Money Around Price” (IOMAP) model reveals that Bitcoin may find stiff support between $10,350 and $10,680. Around these price levels, roughly 771,000 addresses had previously purchased nearly 605,000 BTC.
Given the magnitude of the recent upswing, a sell-off may trigger panic among market participants who bought in too late. If this were to happen, the pioneer cryptocurrency could lose the $10,600 as support. Under such circumstances, the next important area of interest lies around $9,800.
This is a critical support level as holders within this range will attempt to remain profitable on their positions in the event of a downswing. They may even buy more Bitcoin to force its price to rebound towards higher highs.
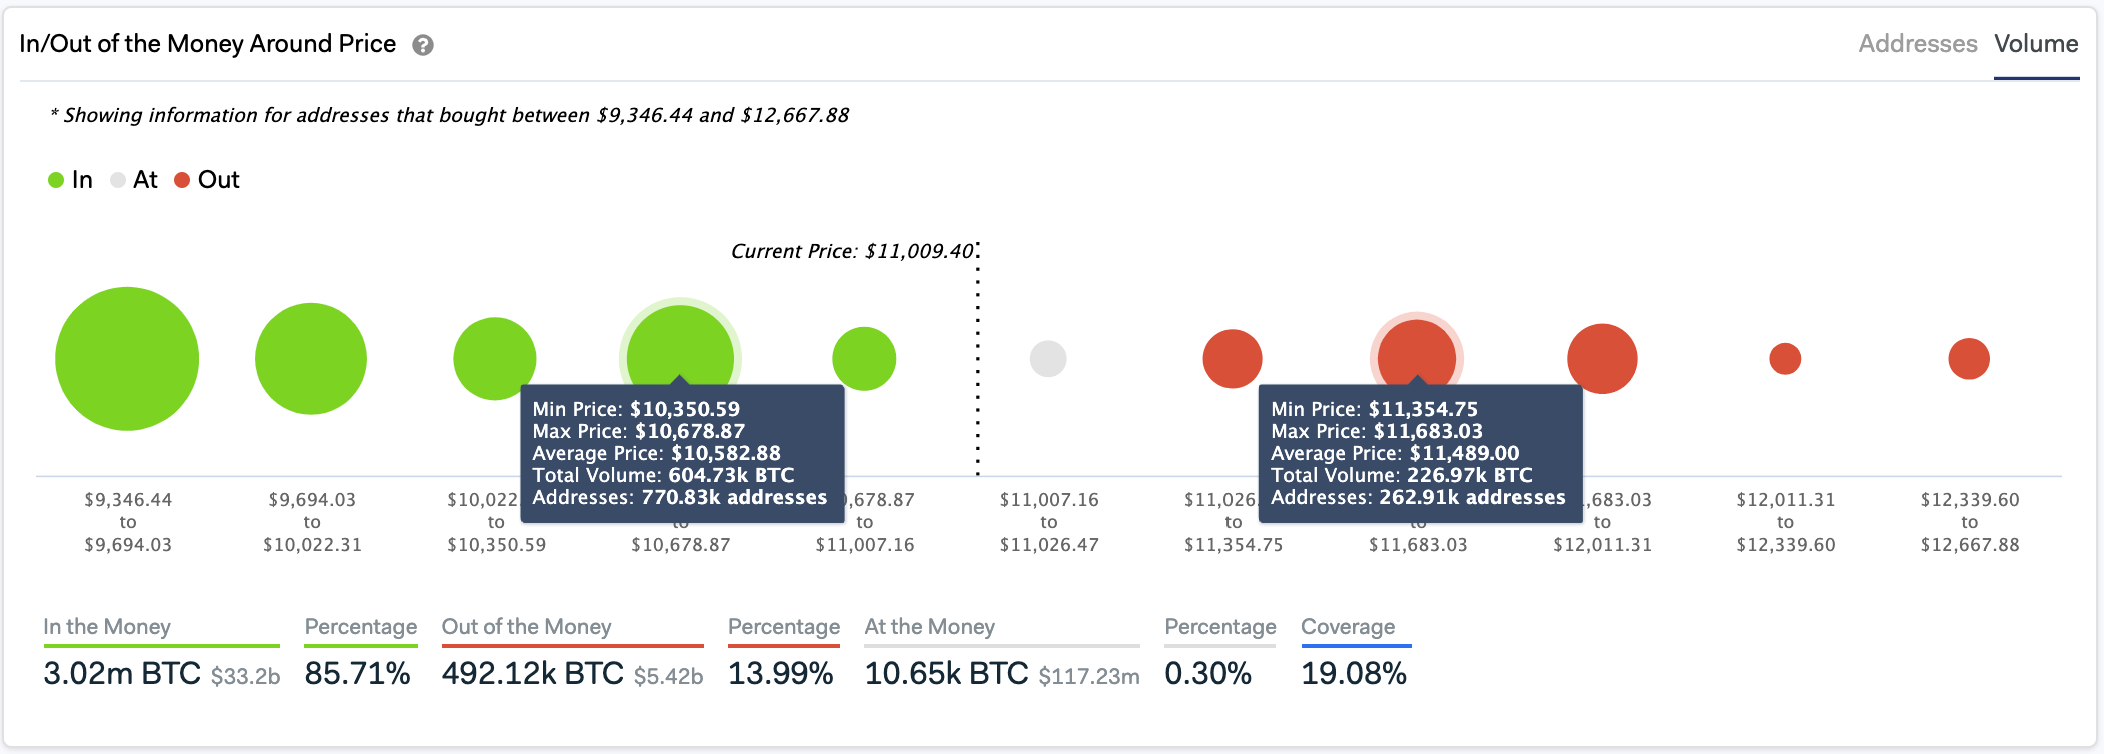
Bitcoin Sits On Top of Massive Supply Wall. (Source: IntoTheBlock)
On the flip side, the IOMAP cohorts show that Bitcoin could have a hard time moving past the $11,500 resistance barrier. Here, nearly 263,000 addresses bought roughly 227,000 BTC. These addresses will likely attempt to break-even on their positions in the event of a bullish impulse.
However, breaking above this price hurdle increases the odds for a further advance towards the next resistance wall at $13,000. Data suggests that there aren’t any major supply barriers in-between that will prevent such an upward movement price movement.
Featured Image from Shutterstock
Price tags: xbtusd, btcusd, btcusdt
Charts from TradingView.com


