

Bitcoin price earlier today broke below $11,500 and within hours slid below $11,400 momentarily. Currently, the leading cryptocurrency by market cap is trying to find support at the critical level. But why is this level so important for bulls to maintain? And if this level is lost, where may targets lie below?
Bitcoin Falls Below Critical Weekly Support at $14,000 But Can Bulls Hold Their Ground?
Bitcoin’s uptrend is now in jeopardy. After the cryptocurrency experienced one of its hottest summers on record, things are potentially ready to cool off for the fall months.
Indicators show that although a long-term uptrend is building on high timeframes, on smaller-timeframes, the short-term downtrend may be ending. The question then is, will this be a short-lived correction swiftly bought up by bulls, or could this be another turn for the worse?
The last major rejection in Bitcoin was at $14,000. A fall from $12,400 would technically be a lower high – a key characteristic of a downtrend.
Black Thursday stopping short of setting a lower low is Bitcoin’s best saving grace from another fall into a bear market, but things may not be as bullish as market sentiment lets on.
Related Reading | Bitcoin Crossroads: Indicator Signals Short-Term Top, But Final Bullish Impulse Is Possible
However, bulls must first lose support at $11,400. The important resistance level dates as far back as November 2017, and was the last level to be breached before the cryptocurrency set its record at $20,000.
After the last week of January 2018, Bitcoin never again closed a weekly candle above the level, proving to be too powerful of resistance – until recently. Just weeks ago, the cryptocurrency broke above the key level and closed multiple weekly candles above.
But now it may be time to come back down to retest various former resistance levels as support, starting with $11,400 – currently in progress.
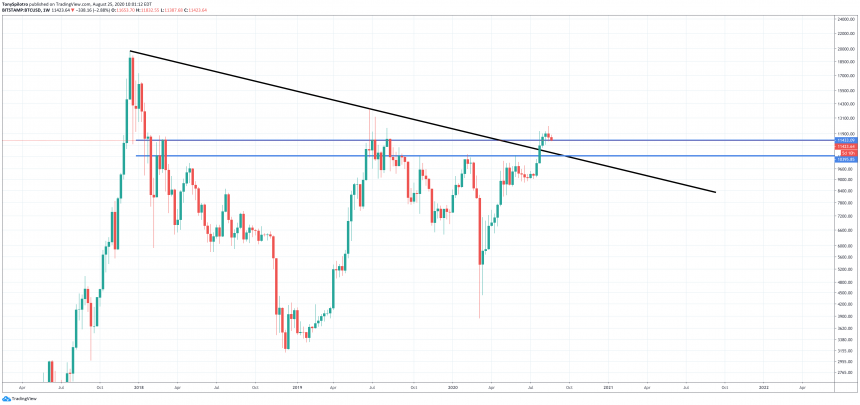
BTCUSD Weekly Support Test In Progress | Source: TradingView
Cryptocurrency Drops To Critical Levels On Key Chart Timeframes, Head And Shoulders Possible
The retest of weekly support, if lost, could send Bitcoin down to retest both diagonal downtrend resistance turned support and horizontal support at $10,250. This confluence of support could be an ideal location to buy the dip if current weekly support fails.
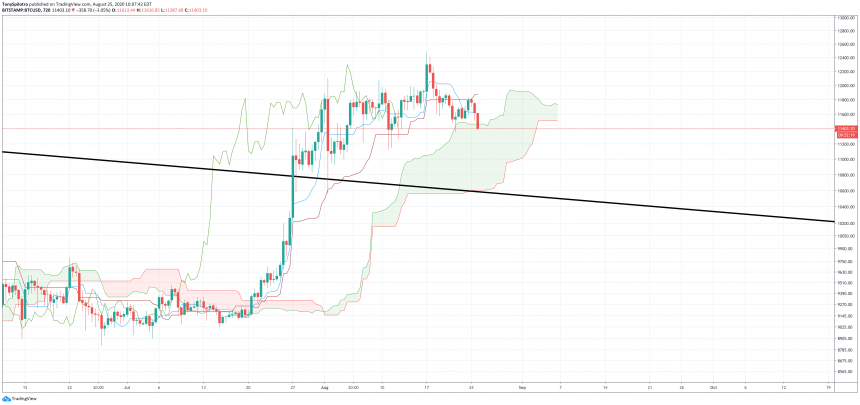
BTCUSD 12-Hour Ichimoku | Source: TradingView
Coinciding with weekly support, on the BTCUSD 12-hour chart, the cryptocurrency is also attempting to find support on the top of the Ichimoku cloud. However, removing the technical analysis indicator, also shows a potential head and shoulders pattern nearing completion.
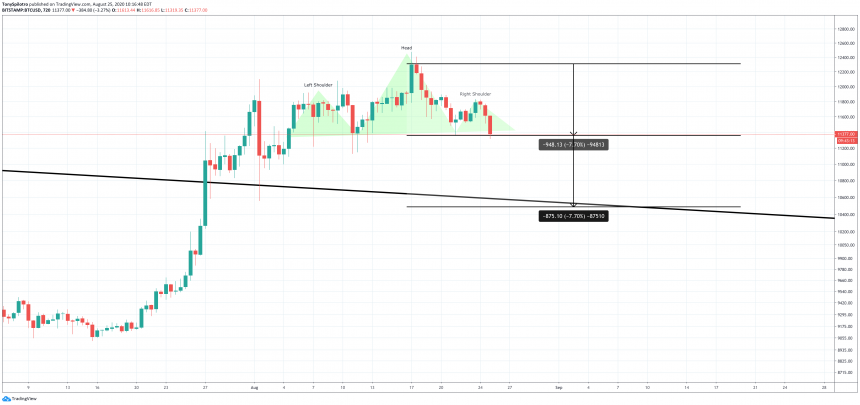
BTCUSD Daily Head And Shoulders | Source: TradingView
A head and shoulders formation is typically a reversal pattern that appears at the top of a rally, just as things turn around. The chart pattern completing, has a target that would line up well with a retest of former downtrend resistance to confirm it as support.
If Bitcoin can hold there, any further downside will be unlikely, and it could be the last correction before the bull market begins.


