

Bitcoin price extended its decline below the $54,000 level against the US Dollar. BTC is holding the $52,500 support, but it must clear $54,000 for a fresh increase.
- Bitcoin failed to stay above the $54,000 support and extended its decline.
- The price is now facing resistance near $54,000 and the 100 hourly simple moving average.
- There is a major declining channel forming with resistance near $54,000 on the hourly chart of the BTC/USD pair (data feed from Kraken).
- The pair could either rally above $54,000 or it might extend its decline towards $50,000.
Bitcoin Price is Facing Hurdles
Bitcoin struggled to continue higher above $55,000 and it started a fresh decline. BTC broke the $54,000 and $53,500 support levels.
There was also a close below the $54,000 level and the 100 hourly simple moving average. The price tested the $52,500 support zone. A low is formed near $52,375 and the price is now consolidating losses. It recovered above the $53,200 level.
There was a break above the 23.6% Fib retracement level of the downward move from the $56,545 swing high to $52,375 low. It seems like the price is now facing resistance near $54,000 and the 100 hourly simple moving average.
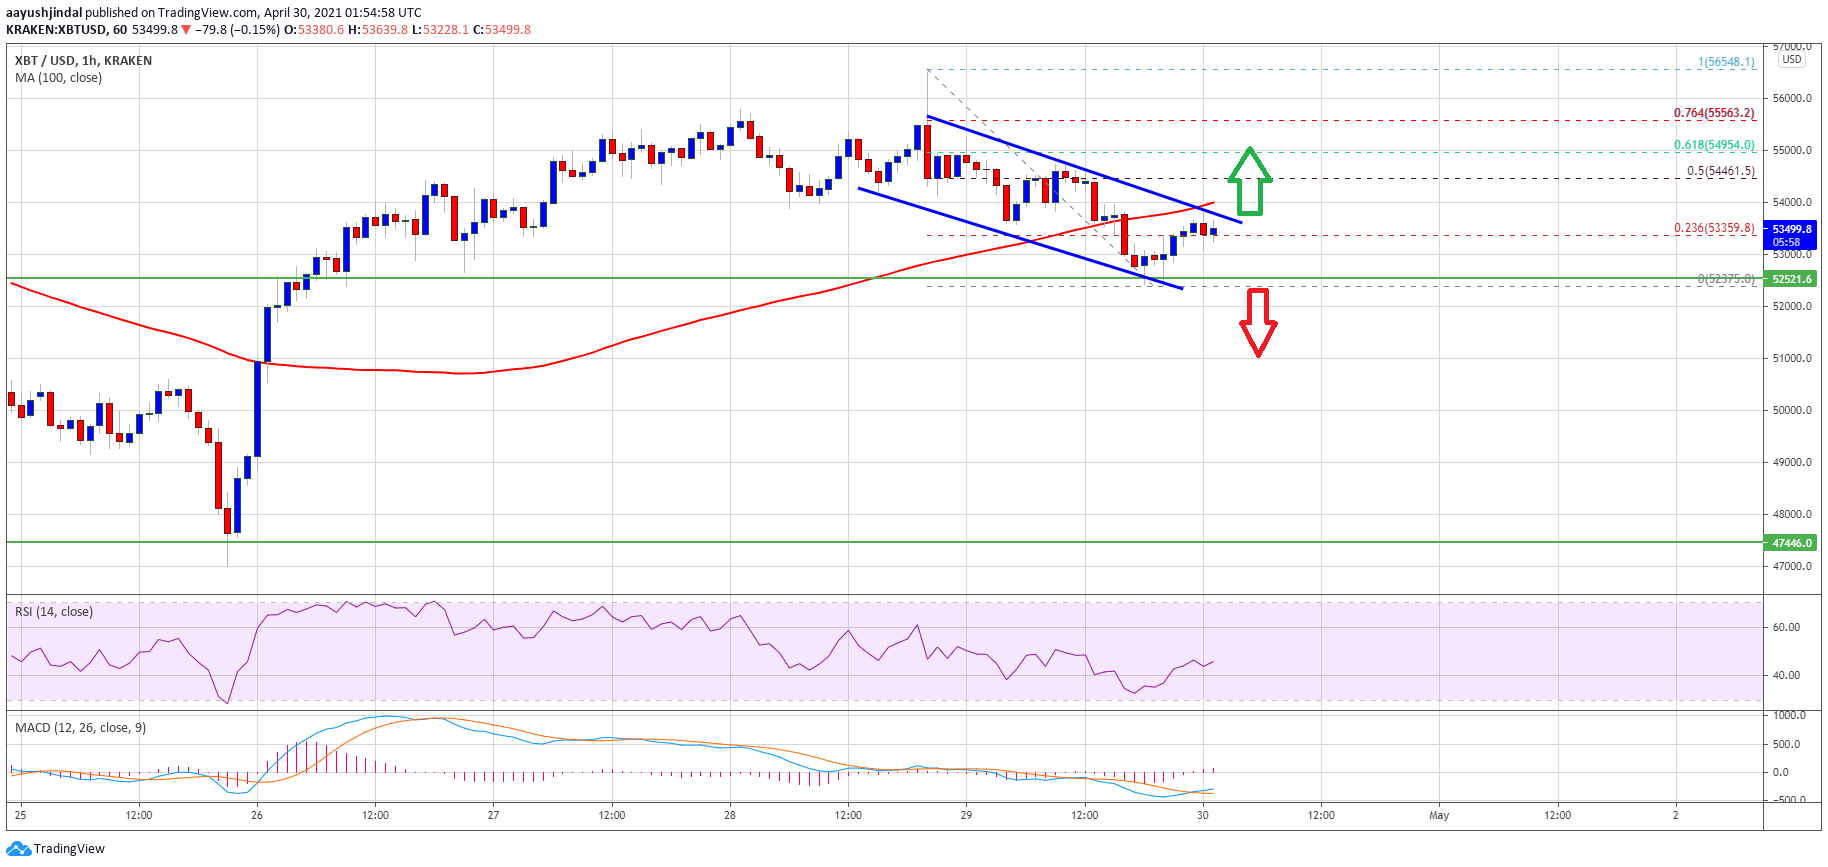
Source: BTCUSD on TradingView.com
There is also a major declining channel forming with resistance near $54,000 on the hourly chart of the BTC/USD pair. The next major resistance is near the $54,500 level. It is near the 50% Fib retracement level of the downward move from the $56,545 swing high to $52,375 low.
A successful break above the channel resistance and then a break above the $54,500 level could set the pace for a fresh increase towards the $56,500 level. The next major resistance above $56,500 could be $58,000.
More Losses in BTC?
If bitcoin fails to clear the $54,000 resistance and the 100 hourly SMA, there is a risk of more downsides. An initial support on the downside is near the $52,500 level.
A proper break and close below the $52,500 level is likely to set the pace for another 5% decline. In the stated case, the price could decline towards the $50,000 support zone in the near term.
Technical indicators:
Hourly MACD – The MACD is now losing pace in the bearish zone.
Hourly RSI (Relative Strength Index) – The RSI for BTC/USD is rising towards the 50 level.
Major Support Levels – $52,500, followed by $50,000.
Major Resistance Levels – $54,000, $54,500 and $56,500.


