

Bitcoin failed to test the $40,000 resistance zone against the US Dollar. BTC is now declining and might slide towards the $36,000 support zone.
- Bitcoin started a fresh decline after it failed to clear the $39,250 resistance zone.
- The price is now trading below $38,000 and the 100 hourly simple moving average.
- There was a break below a major bullish trend line with support near $37,500 on the hourly chart of the BTC/USD pair (data feed from Kraken).
- The pair could continue to decline towards the $36,000 support or even $35,500.
Bitcoin Price Tops Below $40K
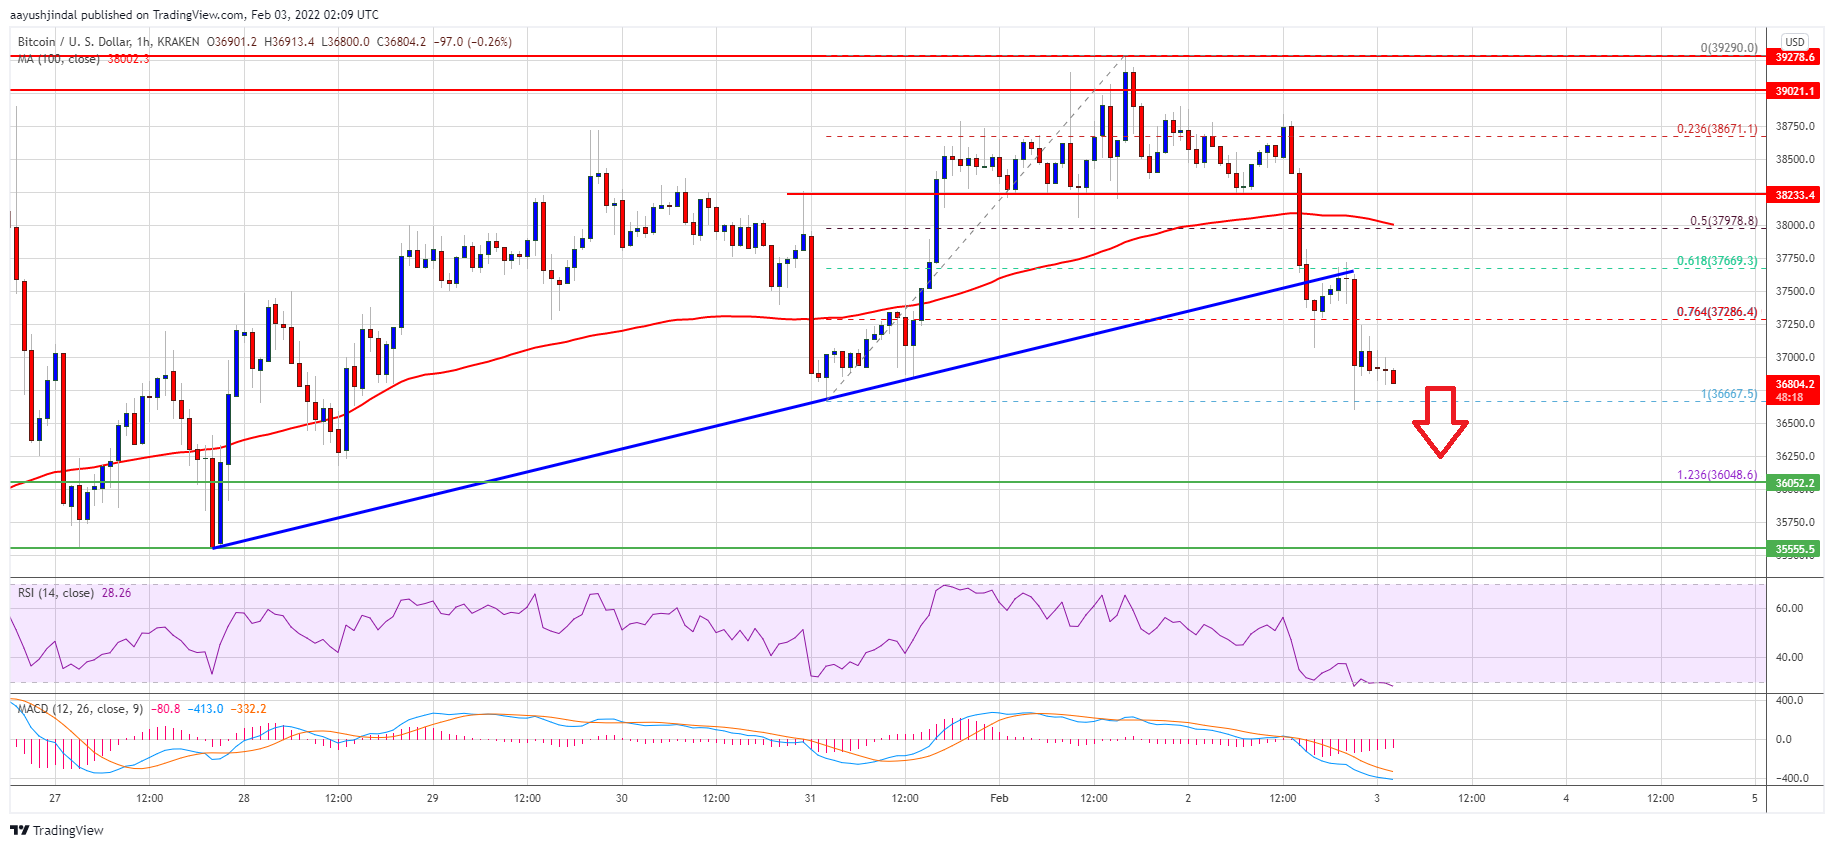
Bitcoin price attempted a move towards the $40,000 resistance zone. However, BTC failed to gain pace above the $39,250 zone. A high was formed near $39,290 and the price started a fresh decline.
There was a clear move below the $38,000 support level and the 100 hourly simple moving average. Besides, there was a break below a major bullish trend line with support near $37,500 on the hourly chart of the BTC/USD pair.
The pair traded below the 76.4% Fib retracement level of the key move from the $36,665 swing low to $39,290 high. It is now showing a few bearish signs below the $37,000 level. On the upside, an initial resistance is near the $37,200 level.
Source: BTCUSD on TradingView.com
The first major resistance is near the $37,500 zone. The main hurdle is now forming near the $38,000 zone and the 100 hourly simple moving average (the recent breakdown zone). A clear move above the $38,000 resistance could start a fresh increase. In the stated case, the price could revisit the $39,250 level.
More Losses in BTC?
If bitcoin fails to start a fresh increase above $38,000, it could continue to move down. An immediate support on the downside is near the $36,650 zone.
The first major support is seen near the $36,000 zone. It is near the 1.236 Fib extension level of the key move from the $36,665 swing low to $39,290 high. Any more losses might call for a move towards the $35,500 support zone in the near term. A downside break below the $35,500 support zone may perhaps call for a drop to $33,200.
Technical indicators:
Hourly MACD – The MACD is now gaining momentum in the bearish zone.
Hourly RSI (Relative Strength Index) – The RSI for BTC/USD is well below the 50 level.
Major Support Levels – $36,000, followed by $35,500.
Major Resistance Levels – $37,500, $38,000 and $39,250.


