

Bitcoin is up more than 7% and it broke the $10,000 resistance against the US Dollar. BTC is showing many bullish signs on the daily chart and it is likely to test $10,500.
- Bitcoin is gaining bullish momentum and it recently spiked above $10,000.
- The current crypto market sentiment is very positive, suggesting more upsides towards $10,500.
- There was a break above a crucial bearish trend line with resistance near $7,800 on the daily chart of the BTC/USD pair (data feed from Kraken).
- Ethereum and ripple are slowly gaining momentum, but they are still below weekly resistances.
Bitcoin Rallies To $10,000
Yesterday, we discussed the chances of a massive rally in bitcoin if it breaks the $9,500 resistance against the US Dollar. BTC price did surpass a few hurdles near $9,400 and $9,500 to start a significant upward move.
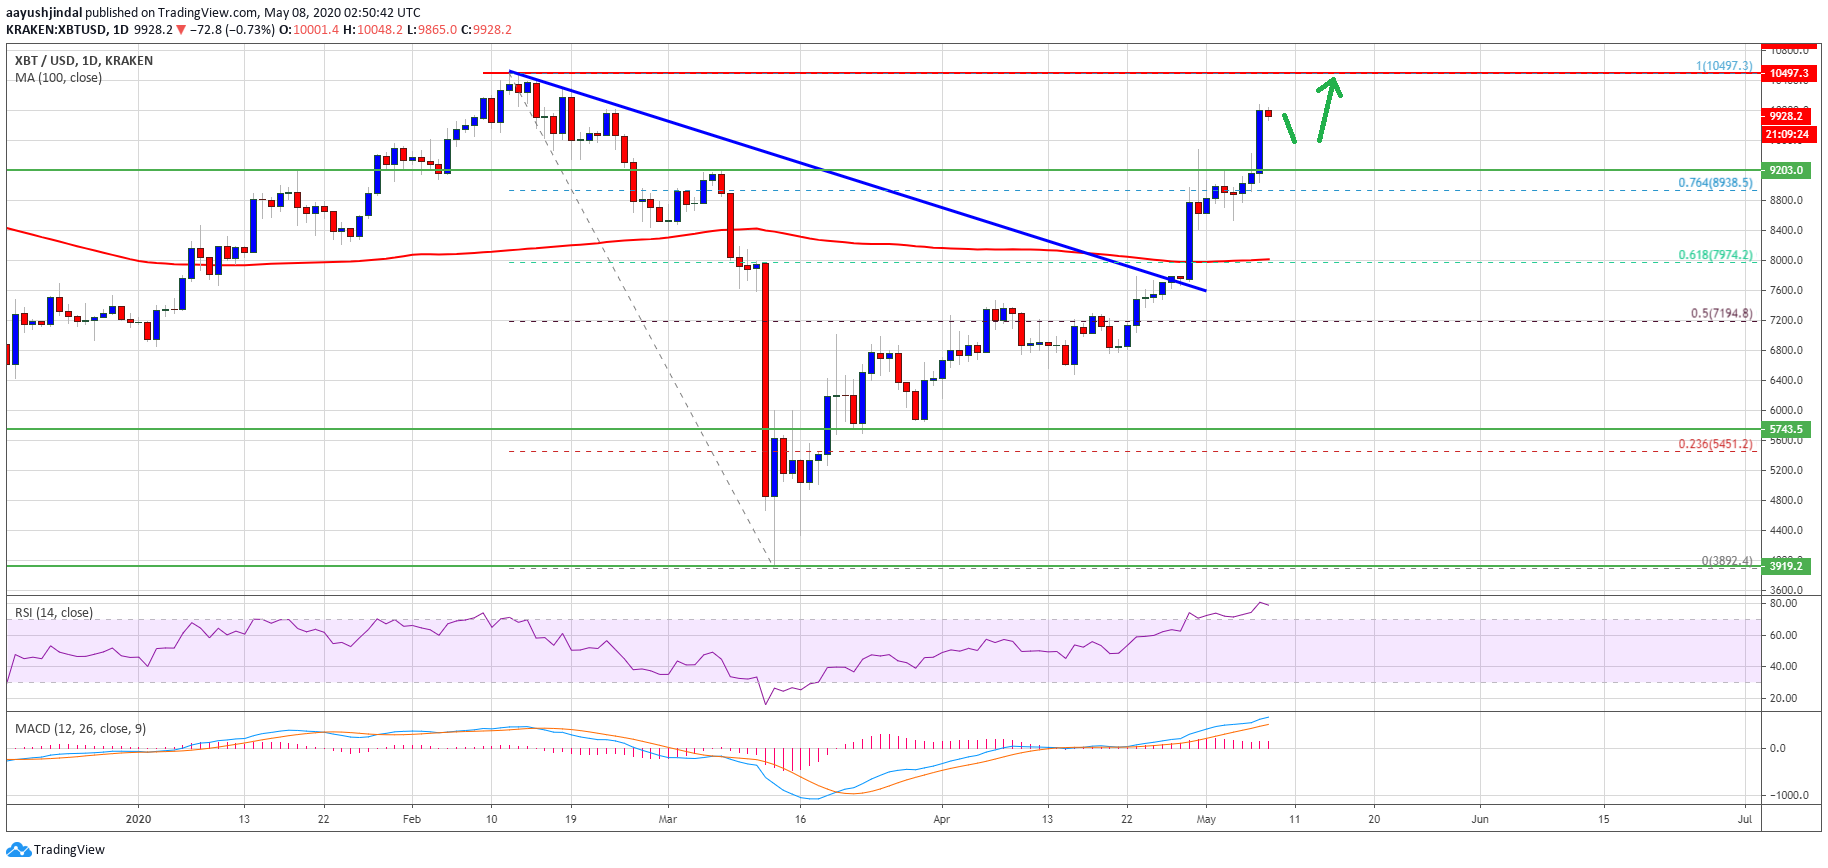
It all started when the bulls managed to push the price above the $7,800 resistance area and the 100-day simple moving average. It opened the doors for a sharp rise above the $8,000 resistance area.
There was also a break above a crucial bearish trend line with resistance near $7,800 on the daily chart of the BTC/USD pair. Recently, the pair consolidated near the $9,000 resistance, and the 61.8% Fib retracement level of the main decline from the $10,497 swing high to $3,892 low.
The bulls gained strength, resulting in a push above the $9,000 and $9,500 resistance levels. Bitcoin even spiked above $10,000 and it is now trading above the 76.4% Fib retracement level of the main decline from the $10,497 swing high to $3,892 low.
It seems like the price is likely to continue higher towards the $10,500 swing high (formed in Feb 2020). Any further gains could lead the price towards the $11,000 and $11,200 resistance levels in the near term.
Short Term Pullback?
In the short term, bitcoin price might correct a few points below the $9,800 level. On the downside, the first support is seen near the $9,500 level (the recent breakout zone).
The main support is now forming near the $9,200 level, where the bulls are likely to take a stand. Any further gains may perhaps call for a test of the $8,000 support or the 100-day simple moving average.
Technical indicators:
Daily MACD – The MACD is currently gaining momentum in the bullish zone.
Daily RSI (Relative Strength Index) – The RSI for BTC/USD is now in the overbought zone.
Major Support Levels – $9,500 followed by $9,200.
Major Resistance Levels – $10,200, $10,500 and $11,000.


 Jumps 15% on Liquidity Mining Data; What’s Next")